RM | Unit 175 - Null hypothesis testing and p values, Type 1 and type 2 error and introduction to
statistical power (sample size) for linear models
Book: Analysing Data Using Linear Models
Chapter 5: 5.6, 5.7, 5.8, 5.9, 5.10, 5.11, 5.14
Chapter 5.6: Null hypothesis testing with linear models
In inferential data analysis, one often works with two hypotheses: the null hypothesis and the alternative
hypothesis.
→ the null hypothesis states that the population slope is equal to 0. Remember that if the
population slope is equal to 0, that is saying that there is no linear relationship between X and Y (that is,
you cannot predict one variable on the basis of the other variable). So there is no linear relationship.
→ the alternative hypothesis states that there is a slope that is different from 0. So, there is a
linear relationship.
→ βslope - population slope.
→ Our data analysis is then aimed at determining which of these two hypotheses is true.
Chapter 5.7: p-values
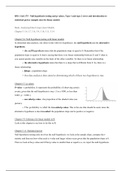
P-value - a probability. It represents the probability of observing certain
events, given that the null hypothesis is true. (1 in a 1000, so less than
0.001: p < 0.001.)
→ one sided p-value - the proportion of the shaded value (see
picture).
→ This probability is called the two-sided p-value. This is the one that should be used, since the
alternative hypothesis is also two-sided: the population slope can be positive or negative.
Chapter 5.9: Inference for linear models in R
Look at this chapter to see how to do this in R.
Chapter 5.11: Statistical power
Null-hypothesis testing only involves the null-hypothesis: we look at the sample slope, compute the t-
statistic and then see how often such a t-value and larger values occur given that the population slope is 0.
Then we look at the p-value and if that p-value is smaller than or equal to α, we reject the null-hypothesis.
statistical power (sample size) for linear models
Book: Analysing Data Using Linear Models
Chapter 5: 5.6, 5.7, 5.8, 5.9, 5.10, 5.11, 5.14
Chapter 5.6: Null hypothesis testing with linear models
In inferential data analysis, one often works with two hypotheses: the null hypothesis and the alternative
hypothesis.
→ the null hypothesis states that the population slope is equal to 0. Remember that if the
population slope is equal to 0, that is saying that there is no linear relationship between X and Y (that is,
you cannot predict one variable on the basis of the other variable). So there is no linear relationship.
→ the alternative hypothesis states that there is a slope that is different from 0. So, there is a
linear relationship.
→ βslope - population slope.
→ Our data analysis is then aimed at determining which of these two hypotheses is true.
Chapter 5.7: p-values
P-value - a probability. It represents the probability of observing certain
events, given that the null hypothesis is true. (1 in a 1000, so less than
0.001: p < 0.001.)
→ one sided p-value - the proportion of the shaded value (see
picture).
→ This probability is called the two-sided p-value. This is the one that should be used, since the
alternative hypothesis is also two-sided: the population slope can be positive or negative.
Chapter 5.9: Inference for linear models in R
Look at this chapter to see how to do this in R.
Chapter 5.11: Statistical power
Null-hypothesis testing only involves the null-hypothesis: we look at the sample slope, compute the t-
statistic and then see how often such a t-value and larger values occur given that the population slope is 0.
Then we look at the p-value and if that p-value is smaller than or equal to α, we reject the null-hypothesis.