Learning goals Advanced Research Methods
Introduction to causal inference
Explain the three different reasons for examining (statistical) associations
Quantitative research primarily aims to examine the association or relationship between
variables, typically denoted as X and Y.
1. Description: This involves identifying patterns in X and Y.
2. Prediction: This aims to predict the outcome Y based on the exposure X.
3. Causal Inference: This focuses on determining the effect of X on Y, answering the
question: "What is the effect on the outcome?".
Explain the potential outcomes approach in causal inference
Causal inference focuses on determining the role of the treatment (X) in achieving a specific
outcome (Y). The potential outcomes approach (also known as the counterfactual approach)
is foundational to this goal.
The core idea is to understand what would have happened to an outcome (Y) had the
exposure (X) not occurred. To make a causal claim about the effect of X on Y, a researcher
needs information on all potential outcomes, specifically:
1. The outcome under treatment (e.g., $Y_{i,a=1}$).
2. The outcome under the absence of treatment (the counterfactual) (e.g., $Y_{i,a=0}$).
The fundamental problem in causal inference is that the individual causal effect cannot be
directly observed because researchers lack information on the counterfactual outcome for
any single individual. For example, for a woman who used a makeup powder (treatment
$A=1$), we know her outcome ($Y_{i,a=1}$), but we cannot observe what her outcome
would have been had she not used the powder ($Y_{i,a=0}$) at the exact same time.
Since the individual causal effect is typically unobservable, the solution is to estimate an
average causal effect in a population by meeting three specific identifiability conditions
Define ‘causal effect’
A formal definition of a causal effect, proposed by Hernán and Robins (2020), is: "In an
individual, a treatment has a causal effect if the outcome under treatment 1 would be
different from the outcome under treatment 2".
Causation is fundamentally defined as the difference between potential (i.e.,
counterfactual) outcomes. If a study successfully estimates this difference in the
population, it yields the average treatment effect.
Apply the concepts of consistency, positivity, and exchangeability to make a causal
claim
To make a valid causal claim—that is, to conclude that the observed statistical association
between an exposure (X) and an outcome (Y) is an unbiased estimate of a causal effect—all
three identifiability conditions must be met.
1. Consistency
The consistency condition requires that the treatment (or exposure X) be well-defined.
• Application: If the exposure is not defined clearly, it is impossible to know what the
counterfactual outcome represents. For example, in a study about make-up powder (X),
consistency was not met because crucial details were missing, such as: What kind of powder
was used? How often was it applied? Under what conditions? And for how long?. Achieving
,consistency ensures that the potential outcomes are meaningfully compared across well-
specified treatments.
2. Positivity
The positivity condition requires that every individual has a positive probability of being
assigned to each treatment arm (i.e., {Pr}>0 for all treatment arms, or levels of X).
• Application: This means there must be sufficient data across all treatment groups to
facilitate comparison. If a researcher studies the effect of a powder (X) on skin quality (Y),
the positivity condition requires that there should be women who use the powder and
women who do not use the powder. If all study participants received the treatment (as in
the L’Oréal example mentioned in the sources, where all 41 women used the powder), the
counterfactual is entirely missing, and positivity is not met.
3. Exchangeability
The exchangeability condition requires that the individuals assigned to the different
treatment arms are comparable or "interchangeable".
• Application: If exchangeability is met, any observed difference in the outcome between
the groups can be attributed solely to the treatment, rather than to other inherent
differences between the individuals. In the L’Oréal example, exchangeability was not met
because there were no two comparable groups of women (one treated, one untreated).
• The condition is perfectly met if, and only if, the only difference between the treatment
groups (the case and control groups) is whether one group received the treatment or not.
• In quantitative research, exchangeability is difficult to achieve, but it can be approximated
through methods like Randomized Controlled Trials (RCTs)—often considered the "gold
standard" because they satisfy all identifiability conditions in principle—or by statistical
adjustment for confounding factors, often identified using Directed Acyclic Graphs (DAGs).
Exchangeability can be achieved by complete and correct adjustment, which involves
controlling for confounding factors that might otherwise bias the association between X and
Y.
1. Randomized Controlled Trial (RCT)
Method: Randomly assign individuals to treatment arms.
Goal: Balance differences (observed and unobserved) across groups.
Logic: Randomization makes treatment independent of potential outcomes.
Result: Any observed difference in outcomes can be attributed to treatment.
Notes: Considered the gold standard because it satisfies identifiability conditions by
design.
2. Matching
Method: Pair (or group) individuals in different treatment groups with similar
characteristics (e.g., x, y, z).
Goal: Make treated and untreated groups comparable on observed covariates.
Types:
o Exact matching: Perfect match on covariates (rare in practice).
o Propensity score matching: Match based on the probability of receiving
treatment given covariates.
Notes: Controls for observed confounding only; unobserved differences may remain.
3. Stratification
Method: Divide the population into subgroups (strata) based on key variables (e.g.,
age, gender, region).
, Goal: Ensure balanced representation and comparability within each stratum.
Process: Randomize or compare within strata, then aggregate results.
Limitations:
o May violate positivity if some strata have no treated or untreated individuals.
o Works best with a small number of strong confounders.
4. Adjustment (Statistical Control)
Method: Control for confounding variables in regression or other models.
Goal: Estimate treatment effects while accounting for covariates.
Key Assumptions:
o Conditional exchangeability: After adjustment, treatment is independent of
potential outcomes.
o Positivity: Every individual could, in principle, receive any treatment.
Tools:
o Regression models, inverse probability weighting, standardization.
o Directed Acyclic Graphs (DAGs): Identify which variables to adjust for.
Notes: Often combined with other methods (e.g., RCT + adjustment for residual
imbalance).
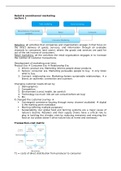
Directed Acyclic Graphs
Understand DAG terminology
DAGs are graphical representations that rely on subject knowledge (previous studies,
literature, common sense) to illustrate the theoretical causal relationships between
variables.
Key Terminology:
• Directed: Connections between variables must follow the direction of arrows, indicating
that X always comes before Y in time. An arrow signifies a possible causal effect, while the
absence of an arrow means there is certainly no causal effect (though researchers should
draw an arrow if in doubt).
• Acyclic: The graph cannot "go round"; a path of arrows should never return to its origin,
meaning a variable cannot cause itself (No X $\rightarrow$ X).
• Paths: Paths describe the relationship between the exposure (X) and the outcome (Y).
◦ Causal Paths: These paths follow the direction of the arrows. Depending on the research
question (RQ), causal paths may need to be opened or closed.
◦ Backdoor Paths (Non-Causal): These paths do not follow the direction of the arrows
(arrows can go in different directions). Backdoor paths transmit non-causal association and
must always be closed to obtain an unbiased estimate.
• Open and Closed Paths:
◦ Open Paths transmit association between variables. All paths are considered open
unless they collide somewhere.
◦ A path is Closed if arrows collide in one variable on that path.
Apply DAG rules to answer a research question
The association between X and Y consists of the combination of all open paths between
them. To answer an RQ in an unbiased manner, researchers must use DAG rules to identify
which paths to adjust for:
1. Blocking Open Paths (Adjustment): An open causal or backdoor path is blocked (closed)
when the researcher adjusts for a variable (L) along that path. This removes the disruptive
Introduction to causal inference
Explain the three different reasons for examining (statistical) associations
Quantitative research primarily aims to examine the association or relationship between
variables, typically denoted as X and Y.
1. Description: This involves identifying patterns in X and Y.
2. Prediction: This aims to predict the outcome Y based on the exposure X.
3. Causal Inference: This focuses on determining the effect of X on Y, answering the
question: "What is the effect on the outcome?".
Explain the potential outcomes approach in causal inference
Causal inference focuses on determining the role of the treatment (X) in achieving a specific
outcome (Y). The potential outcomes approach (also known as the counterfactual approach)
is foundational to this goal.
The core idea is to understand what would have happened to an outcome (Y) had the
exposure (X) not occurred. To make a causal claim about the effect of X on Y, a researcher
needs information on all potential outcomes, specifically:
1. The outcome under treatment (e.g., $Y_{i,a=1}$).
2. The outcome under the absence of treatment (the counterfactual) (e.g., $Y_{i,a=0}$).
The fundamental problem in causal inference is that the individual causal effect cannot be
directly observed because researchers lack information on the counterfactual outcome for
any single individual. For example, for a woman who used a makeup powder (treatment
$A=1$), we know her outcome ($Y_{i,a=1}$), but we cannot observe what her outcome
would have been had she not used the powder ($Y_{i,a=0}$) at the exact same time.
Since the individual causal effect is typically unobservable, the solution is to estimate an
average causal effect in a population by meeting three specific identifiability conditions
Define ‘causal effect’
A formal definition of a causal effect, proposed by Hernán and Robins (2020), is: "In an
individual, a treatment has a causal effect if the outcome under treatment 1 would be
different from the outcome under treatment 2".
Causation is fundamentally defined as the difference between potential (i.e.,
counterfactual) outcomes. If a study successfully estimates this difference in the
population, it yields the average treatment effect.
Apply the concepts of consistency, positivity, and exchangeability to make a causal
claim
To make a valid causal claim—that is, to conclude that the observed statistical association
between an exposure (X) and an outcome (Y) is an unbiased estimate of a causal effect—all
three identifiability conditions must be met.
1. Consistency
The consistency condition requires that the treatment (or exposure X) be well-defined.
• Application: If the exposure is not defined clearly, it is impossible to know what the
counterfactual outcome represents. For example, in a study about make-up powder (X),
consistency was not met because crucial details were missing, such as: What kind of powder
was used? How often was it applied? Under what conditions? And for how long?. Achieving
,consistency ensures that the potential outcomes are meaningfully compared across well-
specified treatments.
2. Positivity
The positivity condition requires that every individual has a positive probability of being
assigned to each treatment arm (i.e., {Pr}>0 for all treatment arms, or levels of X).
• Application: This means there must be sufficient data across all treatment groups to
facilitate comparison. If a researcher studies the effect of a powder (X) on skin quality (Y),
the positivity condition requires that there should be women who use the powder and
women who do not use the powder. If all study participants received the treatment (as in
the L’Oréal example mentioned in the sources, where all 41 women used the powder), the
counterfactual is entirely missing, and positivity is not met.
3. Exchangeability
The exchangeability condition requires that the individuals assigned to the different
treatment arms are comparable or "interchangeable".
• Application: If exchangeability is met, any observed difference in the outcome between
the groups can be attributed solely to the treatment, rather than to other inherent
differences between the individuals. In the L’Oréal example, exchangeability was not met
because there were no two comparable groups of women (one treated, one untreated).
• The condition is perfectly met if, and only if, the only difference between the treatment
groups (the case and control groups) is whether one group received the treatment or not.
• In quantitative research, exchangeability is difficult to achieve, but it can be approximated
through methods like Randomized Controlled Trials (RCTs)—often considered the "gold
standard" because they satisfy all identifiability conditions in principle—or by statistical
adjustment for confounding factors, often identified using Directed Acyclic Graphs (DAGs).
Exchangeability can be achieved by complete and correct adjustment, which involves
controlling for confounding factors that might otherwise bias the association between X and
Y.
1. Randomized Controlled Trial (RCT)
Method: Randomly assign individuals to treatment arms.
Goal: Balance differences (observed and unobserved) across groups.
Logic: Randomization makes treatment independent of potential outcomes.
Result: Any observed difference in outcomes can be attributed to treatment.
Notes: Considered the gold standard because it satisfies identifiability conditions by
design.
2. Matching
Method: Pair (or group) individuals in different treatment groups with similar
characteristics (e.g., x, y, z).
Goal: Make treated and untreated groups comparable on observed covariates.
Types:
o Exact matching: Perfect match on covariates (rare in practice).
o Propensity score matching: Match based on the probability of receiving
treatment given covariates.
Notes: Controls for observed confounding only; unobserved differences may remain.
3. Stratification
Method: Divide the population into subgroups (strata) based on key variables (e.g.,
age, gender, region).
, Goal: Ensure balanced representation and comparability within each stratum.
Process: Randomize or compare within strata, then aggregate results.
Limitations:
o May violate positivity if some strata have no treated or untreated individuals.
o Works best with a small number of strong confounders.
4. Adjustment (Statistical Control)
Method: Control for confounding variables in regression or other models.
Goal: Estimate treatment effects while accounting for covariates.
Key Assumptions:
o Conditional exchangeability: After adjustment, treatment is independent of
potential outcomes.
o Positivity: Every individual could, in principle, receive any treatment.
Tools:
o Regression models, inverse probability weighting, standardization.
o Directed Acyclic Graphs (DAGs): Identify which variables to adjust for.
Notes: Often combined with other methods (e.g., RCT + adjustment for residual
imbalance).
Directed Acyclic Graphs
Understand DAG terminology
DAGs are graphical representations that rely on subject knowledge (previous studies,
literature, common sense) to illustrate the theoretical causal relationships between
variables.
Key Terminology:
• Directed: Connections between variables must follow the direction of arrows, indicating
that X always comes before Y in time. An arrow signifies a possible causal effect, while the
absence of an arrow means there is certainly no causal effect (though researchers should
draw an arrow if in doubt).
• Acyclic: The graph cannot "go round"; a path of arrows should never return to its origin,
meaning a variable cannot cause itself (No X $\rightarrow$ X).
• Paths: Paths describe the relationship between the exposure (X) and the outcome (Y).
◦ Causal Paths: These paths follow the direction of the arrows. Depending on the research
question (RQ), causal paths may need to be opened or closed.
◦ Backdoor Paths (Non-Causal): These paths do not follow the direction of the arrows
(arrows can go in different directions). Backdoor paths transmit non-causal association and
must always be closed to obtain an unbiased estimate.
• Open and Closed Paths:
◦ Open Paths transmit association between variables. All paths are considered open
unless they collide somewhere.
◦ A path is Closed if arrows collide in one variable on that path.
Apply DAG rules to answer a research question
The association between X and Y consists of the combination of all open paths between
them. To answer an RQ in an unbiased manner, researchers must use DAG rules to identify
which paths to adjust for:
1. Blocking Open Paths (Adjustment): An open causal or backdoor path is blocked (closed)
when the researcher adjusts for a variable (L) along that path. This removes the disruptive