Assignment lecture 1
Example of a Dose-Response study
You have learned in the introduction to toxicology lecture about dose response curves. With this
assignment you can practise how to make a dose response analysis. The data is based on a standard test
used to assess the developmental toxicity of substances. The test uses zebrafish embryos (Danio rerio). For
the test fertilized eggs are exposed to different concentrations of the test compound and a positive and
negative control. The embryos are checked daily for abnormalities. For this exercise pictures where taken
after 48 h. The pictures can be found in section I. In section II you can find the corresponding information
about effects on the heartbeat and the movement of the exposed embryos. In order to make a dose
response curve and to determine the LOEC, NOEC, LC50, EC50 and TI, you have to first score the
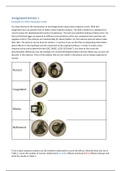
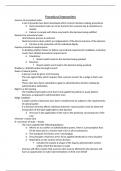
pictures/table. Bellow you can see example of a normal developed embryo and the affects you can you will
discover in this exercise. Parts of the embryo that are not visible in the picture can be always expected as
normal.
Normal
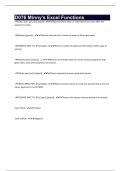
Coagulated
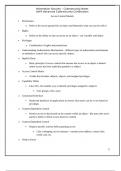
Edema
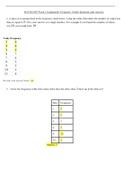
Malformed
To do a dose-response analysis use the checklist underneath to score the effects. Describe what you see in
Table 1. Count the number of normal, malformed (non lethal effects) and dead (lethal effects) embryos and
write the results in Table 2.
,Checklist:
Lethal effects: Non lethal effects: No effects:
D =dead (no movement + no heartbeat) M =Malformations (e.g. Edema) - = No effects
Tab.1: Describe what you see
Concentration 1 2 3 4 5 6 7 8 9 10 11 12
1 - - - - - - - - - D - -
2 M - - - - - - M M - - M
3 M M M M M M M M M D M M
4 D M D M D M D M M M D M
5 D D D D D D D D D D D D
Negative
- - - - - - - - - - - D
control
Positive
D D D D D D D D D D D D
control
, Tab.2: Results of the experiment
Number of embryos with lethal or non
lethal effects
%
Mortality
Lethal Non lethal (only % Effected (non
Concentration Normal effects effects lethal) lethal + lethal)
1 11 1 0 8.3% 8.3%
2 8 0 4 0% 33.3%
3 0 1 11 8.3% 100%
4 0 5 7 41.7% 100%
5 0 12 0 100% 100%
Positive Control 0 12 0 100% 100%
Negative Control 11 1 0 8.3% 8.3%
Draw the Dose-response curve for lethal and effected embryos (XY-plot; X=concentration, Y=percentage of
effected or dead embryos like shown in Figure 3).
Fig.:1 Dose-Response curve for lethal and non-lethal effects
Example of a Dose-Response study
You have learned in the introduction to toxicology lecture about dose response curves. With this
assignment you can practise how to make a dose response analysis. The data is based on a standard test
used to assess the developmental toxicity of substances. The test uses zebrafish embryos (Danio rerio). For
the test fertilized eggs are exposed to different concentrations of the test compound and a positive and
negative control. The embryos are checked daily for abnormalities. For this exercise pictures where taken
after 48 h. The pictures can be found in section I. In section II you can find the corresponding information
about effects on the heartbeat and the movement of the exposed embryos. In order to make a dose
response curve and to determine the LOEC, NOEC, LC50, EC50 and TI, you have to first score the
pictures/table. Bellow you can see example of a normal developed embryo and the affects you can you will
discover in this exercise. Parts of the embryo that are not visible in the picture can be always expected as
normal.
Normal
Coagulated
Edema
Malformed
To do a dose-response analysis use the checklist underneath to score the effects. Describe what you see in
Table 1. Count the number of normal, malformed (non lethal effects) and dead (lethal effects) embryos and
write the results in Table 2.
,Checklist:
Lethal effects: Non lethal effects: No effects:
D =dead (no movement + no heartbeat) M =Malformations (e.g. Edema) - = No effects
Tab.1: Describe what you see
Concentration 1 2 3 4 5 6 7 8 9 10 11 12
1 - - - - - - - - - D - -
2 M - - - - - - M M - - M
3 M M M M M M M M M D M M
4 D M D M D M D M M M D M
5 D D D D D D D D D D D D
Negative
- - - - - - - - - - - D
control
Positive
D D D D D D D D D D D D
control
, Tab.2: Results of the experiment
Number of embryos with lethal or non
lethal effects
%
Mortality
Lethal Non lethal (only % Effected (non
Concentration Normal effects effects lethal) lethal + lethal)
1 11 1 0 8.3% 8.3%
2 8 0 4 0% 33.3%
3 0 1 11 8.3% 100%
4 0 5 7 41.7% 100%
5 0 12 0 100% 100%
Positive Control 0 12 0 100% 100%
Negative Control 11 1 0 8.3% 8.3%
Draw the Dose-response curve for lethal and effected embryos (XY-plot; X=concentration, Y=percentage of
effected or dead embryos like shown in Figure 3).
Fig.:1 Dose-Response curve for lethal and non-lethal effects