Assignment 2. Social Support and Satisfaction
in Women’s Networks
N1
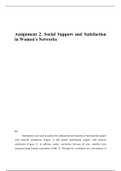
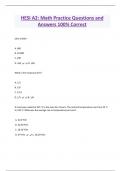
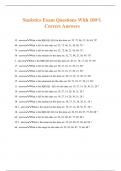
Scatterplots were used to explore the relationship and linearity of instrumental support
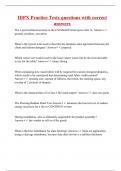
with network satisfaction (Figure 1) and global instrumental support with network
satisfaction (Figure 2). In addition, matrix correlation between all nine variables were
measured using Pearson correlation (Table 1). Through the correlation test, convergence of
, support scales and global questions can be checked and correlation between social support
and network satisfaction can be assumed.
Figure 1. Scatter plots of instrumental support scale on network satisfaction
Figure 2. Scatter plots of global instrumental support question on network satisfaction
in Women’s Networks
N1
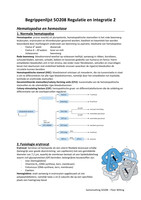
Scatterplots were used to explore the relationship and linearity of instrumental support
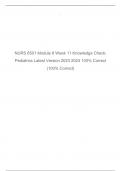
with network satisfaction (Figure 1) and global instrumental support with network
satisfaction (Figure 2). In addition, matrix correlation between all nine variables were
measured using Pearson correlation (Table 1). Through the correlation test, convergence of
, support scales and global questions can be checked and correlation between social support
and network satisfaction can be assumed.
Figure 1. Scatter plots of instrumental support scale on network satisfaction
Figure 2. Scatter plots of global instrumental support question on network satisfaction