MATH 225N Week 5 Assignment; Evaluating Probability Using the Normal Distribution
494 views 0 purchase
Course
MATH 225N (MATH225N)
Institution
Chamberlain College Of Nursing
1. Question: Ms. Wilson's math test scores are normally distributed with a mean score of 73 (μ) and a standard deviation of 5 (σ). Using the Empirical Rule, about 99.7% of the scores lie between which two values?
2. Question: Mrs. Miller's geometry test scores are normally distributed with a mea...
MATH 225N Week 5 Assignment: Evaluating
Probability Using the Normal Distribution
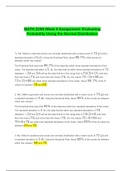
1 . Ms. Wilson's math test scores are normally distributed with a mean score of 73 (μ) and a
standard deviation of 5 (σ). Using the Empirical Rule, about 99.7% of the scores lie
between which two values?
The Empirical Rule says that 99.7% of the data lies within three standard deviations of the
mean. The standard deviation is 5. So, the data that lie within three standard deviations of 73
(between −3σ and 3σ) will be the data that lie in the range that is (5)(3)=15 units less
than the mean (73) and more than the mean (73). So, the values 73−15=58 and
73+15=88 are within three standard deviations of the mean. About 99.7% of the x-
values lie between 58 and 88.
2. Mrs. Miller's geometry test scores are normally distributed with a mean score of 70 (μ) and
a standard deviation of 3 (σ). Using the Empirical Rule, about 95% of the scores lie between
which two values?
The Empirical Rule says that 95% of the data lies within two standard deviations of the mean.
The standard deviation is 3. So, the data that lie within two standard deviations of 70
(between −2σ and 2σ) will be the data that lie in the range that is (3)(2)=6 units less
than the mean (70) and more than the mean (70). So, the values 70−6=64 and
70+6=76 are within two standard deviations of the mean. About 95% of the x-values lie
between 64 and 76.
3. Ms. Wilson's statistics test scores are normally distributed with a mean score of 72 (μ) and
a standard deviation of 3 (σ). Using the Empirical Rule, about 68% of the scores lie between
which two values? 69 and 75.
The benefits of buying summaries with Stuvia:
Guaranteed quality through customer reviews
Stuvia customers have reviewed more than 700,000 summaries. This how you know that you are buying the best documents.
Quick and easy check-out
You can quickly pay through credit card or Stuvia-credit for the summaries. There is no membership needed.
Focus on what matters
Your fellow students write the study notes themselves, which is why the documents are always reliable and up-to-date. This ensures you quickly get to the core!
Frequently asked questions
What do I get when I buy this document?
You get a PDF, available immediately after your purchase. The purchased document is accessible anytime, anywhere and indefinitely through your profile.
Satisfaction guarantee: how does it work?
Our satisfaction guarantee ensures that you always find a study document that suits you well. You fill out a form, and our customer service team takes care of the rest.
Who am I buying these notes from?
Stuvia is a marketplace, so you are not buying this document from us, but from seller Milestonee. Stuvia facilitates payment to the seller.
Will I be stuck with a subscription?
No, you only buy these notes for $21.25. You're not tied to anything after your purchase.