lesson3 Describingdistribution even iftheyare not
the same height
shape of distribution numberofmodesanypeakisconsidered a mode
symmetryorskewness
variations
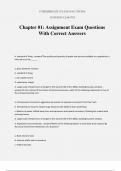
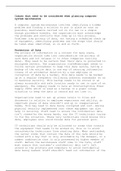
Modes
uniformdistribution no mode s
unimodal one peak mode bimodal 2 trimodal 3
mean median mode
same mirrorma
is si
3
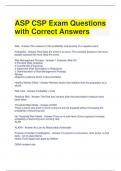
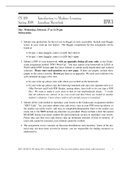
Symmetry if its left half andrighthalf are identical mean media
Ime.anesareoutiiersatiowvam
Jeff skewed
negatively
right skewed
or positively
outliersatlowvalues outliersathighvalues
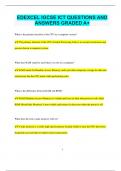
Variation
measures howmuchthevaluesarespread outfrom thecenter of a data set
dataclustered lowvariation
wider moderated or high
Range QuartilesPercentiles
Range differencebetweenthelowest and the highestvalues
1 2,3 4,5 5 1 4
andividesthe lowestforthofadata
set themedianofthelowesthalf
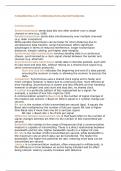
Quartiles dividedistribution into 4 parts
1 3 7,9 10 13 15 17 19 22 25 Q2 isthe median
Q1 Q2 Qs
Q3 dividesthelowestthreeforths
of adatasetmedianofoftheupperset
Exexcel quartileInc B2 B3217213
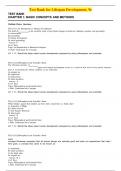
, Once we know the quartiles we can describe a distribution with a
five numbersummary s
low value lowerquartile the median theupperquartileand the highvalue
minimum Q1 Q2 Qs maximum
Bedisplayed with a boxplot p 136
Percentiles divide the distributioninto700parts
1 3 17,9 10 13 15 17 19 22 25
25th Soth 75th
Howto find it numbers of lessthanthis datavalues 100
total number of data values
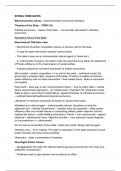
Standard deviation
The measure of how widely data values are spreadaround themean of thedatas
is the measure of the average ofall the deviationsfrom the mean
To calculateit Onexcel STDEV By p
Find the mean
How much eachdatadeviatesfromthe mean for
step1 anydata valueby
substractingthe mean from thedatavalue
deviationfrom mean data value mean
step2 Find the squares of all the deviationsfrom the mean
step3 Addallthe squares of the deviationsfrom the mean
step4 Divide this sum by thetotal number of datavalues minus 1 alsocalledvarianc
step5 Standard deviation
sum of deviationsfrom the mean 2
Total numberof datavalues I
the same height
shape of distribution numberofmodesanypeakisconsidered a mode
symmetryorskewness
variations
Modes
uniformdistribution no mode s
unimodal one peak mode bimodal 2 trimodal 3
mean median mode
same mirrorma
is si
3
Symmetry if its left half andrighthalf are identical mean media
Ime.anesareoutiiersatiowvam
Jeff skewed
negatively
right skewed
or positively
outliersatlowvalues outliersathighvalues
Variation
measures howmuchthevaluesarespread outfrom thecenter of a data set
dataclustered lowvariation
wider moderated or high
Range QuartilesPercentiles
Range differencebetweenthelowest and the highestvalues
1 2,3 4,5 5 1 4
andividesthe lowestforthofadata
set themedianofthelowesthalf
Quartiles dividedistribution into 4 parts
1 3 7,9 10 13 15 17 19 22 25 Q2 isthe median
Q1 Q2 Qs
Q3 dividesthelowestthreeforths
of adatasetmedianofoftheupperset
Exexcel quartileInc B2 B3217213
, Once we know the quartiles we can describe a distribution with a
five numbersummary s
low value lowerquartile the median theupperquartileand the highvalue
minimum Q1 Q2 Qs maximum
Bedisplayed with a boxplot p 136
Percentiles divide the distributioninto700parts
1 3 17,9 10 13 15 17 19 22 25
25th Soth 75th
Howto find it numbers of lessthanthis datavalues 100
total number of data values
Standard deviation
The measure of how widely data values are spreadaround themean of thedatas
is the measure of the average ofall the deviationsfrom the mean
To calculateit Onexcel STDEV By p
Find the mean
How much eachdatadeviatesfromthe mean for
step1 anydata valueby
substractingthe mean from thedatavalue
deviationfrom mean data value mean
step2 Find the squares of all the deviationsfrom the mean
step3 Addallthe squares of the deviationsfrom the mean
step4 Divide this sum by thetotal number of datavalues minus 1 alsocalledvarianc
step5 Standard deviation
sum of deviationsfrom the mean 2
Total numberof datavalues I