Coursepack, p. 296
Name: 3. t k
Math 133: 2.2 Worksheet #2
2.2 WS #2: Organizing Quantitative Data
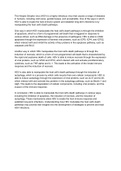
1. The following graph shows the Plastic Waste Rate (grams per person per day) for a random
sample of countries in the world. (Source)
Number of countries
46
404
30
23
20. 19
10
3
1
100 200 300 400 500 600 700
Plastic Waste Rate (g/person/day)
a. The chart above is an example of what type of chart? (Circle one)
Frequency Bar Chart Frequency Pareto Chart Frequency Histogram
Relative FrequencyBar Chart Relative Frequency Pareto Chart Relative Frequency Histogram
b. What is n? (Give context and value) 153 Ceutie S
c. The tallest bar has a value of 46on top. What does this mean in the context of the
situation? (Be specific and include discussion of plastic waste)
d. Mow many countrieshave Plastic Waste Rates at 350 g/person/day or above?
e. What percent of countries have Plastic Waste Rates less than 150 g/person/day? (Give 1
dec. place)
f. What is the shape of this distribution? (Circle One)
Skewed Left Symmetric Skewed Right
This study source was downloaded by 100000900706475 from CourseHero.com on 10-08-2025 05:00:28 GMT -05:00
https://www.coursehero.com/file/251444959/blank222pdf/
Name: 3. t k
Math 133: 2.2 Worksheet #2
2.2 WS #2: Organizing Quantitative Data
1. The following graph shows the Plastic Waste Rate (grams per person per day) for a random
sample of countries in the world. (Source)
Number of countries
46
404
30
23
20. 19
10
3
1
100 200 300 400 500 600 700
Plastic Waste Rate (g/person/day)
a. The chart above is an example of what type of chart? (Circle one)
Frequency Bar Chart Frequency Pareto Chart Frequency Histogram
Relative FrequencyBar Chart Relative Frequency Pareto Chart Relative Frequency Histogram
b. What is n? (Give context and value) 153 Ceutie S
c. The tallest bar has a value of 46on top. What does this mean in the context of the
situation? (Be specific and include discussion of plastic waste)
d. Mow many countrieshave Plastic Waste Rates at 350 g/person/day or above?
e. What percent of countries have Plastic Waste Rates less than 150 g/person/day? (Give 1
dec. place)
f. What is the shape of this distribution? (Circle One)
Skewed Left Symmetric Skewed Right
This study source was downloaded by 100000900706475 from CourseHero.com on 10-08-2025 05:00:28 GMT -05:00
https://www.coursehero.com/file/251444959/blank222pdf/