MATH 110 Final Exam - Requir es Respondus
LockDow n B r ow ser + W ebcam
Due No due date Points 100 Questions 10 Time Limit 120 Minutes
Requires Respondus LockDown Browser
Instructions
The final exam is comprehensive in nature, and includes questions from covering material from all 10
modules.
,You may only have the following items when taking an exam: computer, 1-2 pieces of blank scratch
paper, a pen/pencil, and a calculator.
You may ONLY use the equation sheets that are provided WITHIN the exam. The use of printed
versions will be considered a violation of the Academic Integrity Policy.
Attempt History
Attempt Time Score
LATEST Attempt 1 83 minutes 0 out of 100 *
* Some questions not yet graded
Score for this quiz: 0 out of 100 *
Submitted Nov 6 at 11:32pm
This attempt took 83 minutes.
Question 1 Not yet graded / 10 pts
You may find the following files helpful throughout the exam:
Statistics_Equation_Sheet
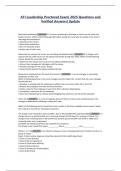
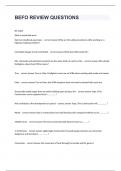
The following pie chart shows the percentages of total items sold in a month in a
certain fast food restaurant.
, A total of 2900 fast food items were sold during the month.
a.) How many were burgers?
b.) How many were fish?
Your Answer:
LockDow n B r ow ser + W ebcam
Due No due date Points 100 Questions 10 Time Limit 120 Minutes
Requires Respondus LockDown Browser
Instructions
The final exam is comprehensive in nature, and includes questions from covering material from all 10
modules.
,You may only have the following items when taking an exam: computer, 1-2 pieces of blank scratch
paper, a pen/pencil, and a calculator.
You may ONLY use the equation sheets that are provided WITHIN the exam. The use of printed
versions will be considered a violation of the Academic Integrity Policy.
Attempt History
Attempt Time Score
LATEST Attempt 1 83 minutes 0 out of 100 *
* Some questions not yet graded
Score for this quiz: 0 out of 100 *
Submitted Nov 6 at 11:32pm
This attempt took 83 minutes.
Question 1 Not yet graded / 10 pts
You may find the following files helpful throughout the exam:
Statistics_Equation_Sheet
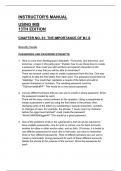
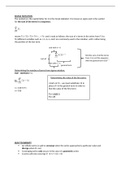
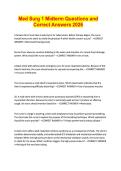
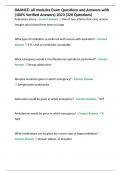
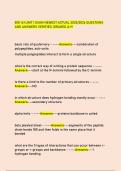
The following pie chart shows the percentages of total items sold in a month in a
certain fast food restaurant.
, A total of 2900 fast food items were sold during the month.
a.) How many were burgers?
b.) How many were fish?
Your Answer: