Step by step Manual
Repeated Measures Analysis
Independent variables are not yet nicely presented (iv and dv are not apart yet, you see all
conditions in a different variable);
you have to define your independent variables yourself.
1. Check the normality between conditions (= normality of the difference)
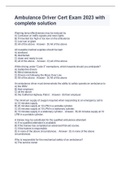
1. Transform > Compute variable
1. Create a variable (d1) for a difference between var1 and var 2 (var1 - var2)
2. Do this per combination
2. Check skewness of kurtosis OR use Kolmogorov-Smirnov;
1. Analyze > Descriptive Statistics > Explore
2. Drag all difference variables in ‘dependent list’
3. Plots > check Normality plots with tests & Histogram
4. Output: check KS-test values.
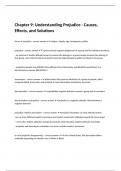
2. Analyze > General Linear Model > Repeated Measures
1. Define your IVs yourself
1. Define name of var
2. Define number of levels
3. Add & repeat for other variable
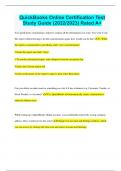
2. Enter conditions into Within-Subjects Variables (name&label moeten overeenkomen)
3. Options > select:
1. Descriptive statistics
2. Estimates of effect size
4. Planned contrast is for specific predictions already;
Post hoc compares everything to everything
1. Planned contrast
1. Contrasts > select Simple for both contrasts
2. Post Hoc
1. EM Means
2. drag your IVs to Display Mean for
3. Select compare main effects
4. Select Bonferroni
3. Output
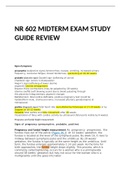
1. Check normality with Kolmogorov-Smirnov test
1. If the test is significant (< .05), the assumption is not met.
2. What to do if assumption is not met?
1. Look at the normal Q-Q plot > if it doesn’t look very bad, it is still ok
2. Look at the histogram > if it looks ok, it’s still ok
3. Chapter 6 of book for other things to do if you have serious problems with
normality of your data (e.g. trimming data, transforming data)
2. Repeated measures test
1. Within-Subject Factors > an overview of your variables. Check if you did this
correctly.
2. Descriptive Statistics > for reporting per condition
3. Multivariate tests > you can ignore this
4. Mauchly’s test of Sphericity
Repeated Measures Analysis
Independent variables are not yet nicely presented (iv and dv are not apart yet, you see all
conditions in a different variable);
you have to define your independent variables yourself.
1. Check the normality between conditions (= normality of the difference)
1. Transform > Compute variable
1. Create a variable (d1) for a difference between var1 and var 2 (var1 - var2)
2. Do this per combination
2. Check skewness of kurtosis OR use Kolmogorov-Smirnov;
1. Analyze > Descriptive Statistics > Explore
2. Drag all difference variables in ‘dependent list’
3. Plots > check Normality plots with tests & Histogram
4. Output: check KS-test values.
2. Analyze > General Linear Model > Repeated Measures
1. Define your IVs yourself
1. Define name of var
2. Define number of levels
3. Add & repeat for other variable
2. Enter conditions into Within-Subjects Variables (name&label moeten overeenkomen)
3. Options > select:
1. Descriptive statistics
2. Estimates of effect size
4. Planned contrast is for specific predictions already;
Post hoc compares everything to everything
1. Planned contrast
1. Contrasts > select Simple for both contrasts
2. Post Hoc
1. EM Means
2. drag your IVs to Display Mean for
3. Select compare main effects
4. Select Bonferroni
3. Output
1. Check normality with Kolmogorov-Smirnov test
1. If the test is significant (< .05), the assumption is not met.
2. What to do if assumption is not met?
1. Look at the normal Q-Q plot > if it doesn’t look very bad, it is still ok
2. Look at the histogram > if it looks ok, it’s still ok
3. Chapter 6 of book for other things to do if you have serious problems with
normality of your data (e.g. trimming data, transforming data)
2. Repeated measures test
1. Within-Subject Factors > an overview of your variables. Check if you did this
correctly.
2. Descriptive Statistics > for reporting per condition
3. Multivariate tests > you can ignore this
4. Mauchly’s test of Sphericity