2 3 Resource consumption security
Global trends in consumption
povertyreduction and the globalmiddle class
aao around son of population in lowincomecountries ines livedon 1.25 a day
in 2015 it was around 14.1
Absolutepoverty
in 1990 i abillionpeoplelived in extremepoverty
in2015836millionpeoplelived in extreme poverty
middleclassairing on at least 4day
Almostt ripledbetween aao and 2015
increase in averageincomes and the tail in peoplelivingin absolutepoverty increase innumber of middleclasspeople
in 2009 around 1.8billionmiddleclasspeople
Europe 664million
iii main
middlec lass importanteconomicfeature helpsincreasesalesofgoods e.gelectricalg oodsmobilephonesandcars
em mentation men mention
manypeople on incomes over 4 dayremain vulnerable to unemployment and underemployment
informal activities line to no security
socioeconomic factors influencingsocialclasses
peopleare disadvantaged on account of theirgenderethnicitydisabilityand geographical location
e g in latinamericawomenaremorelikely to live in poverty than men
ratio of poorwomen poormen 108 100 in mat 117 100 in 2012
Globallyabout751 ofmen are part of thegloball abourfacewhereasonly 50 ofwomenare part of thegloballaborforce
onaveragewomenearn 25 lessthan men on average
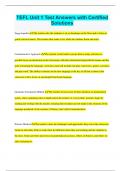
Global consumption of resources
Ecologicalfootprints hypotheticala reaoflandrequiredby a society agroupor anindividual tofulfill an their resourceneeds and assimilate
antheirwastes measured inglobaln ectaresigna
Acountrydescribedas havingan ecological footprintof 3.2 its own geographicalarea is consumingresourcesand assimilating its
wastes on ascale that wouldrequire a land 3.2 largerthan the actualsize of the country
theirland area arelivingbeyond sustainable limits
can I iiit.itim iaiingian
Allowdirectcomparisons betweengroupsand individuals
legwas vs ties keystat
1.3gnalandavailableperperson for the population of the earth
Thereis anestimate of
v N estimatesby2030we winneedthe equivalent of 2 earns to supply the world's population with an the resources it wants
country candecrease its ecologicalfootprintby A countryincreases its ecologicalfootprintby
reducing theamountsof resources ituses relyingheavilyonfossilfuels
recyclingresources increasing its use oftechnologyandthereforeenergy
, reusingresources highlevelsofimportedresourcesinigntransportcosts
improvingoneexicencyofresourceuse largepercapitaproduction ofcarso nwasteinignenergyuse
reducingthe amount of pollution it produces highfossilfuelsuses
waste to othercountries todealwith
transporting largeperc apitaconsumptionoffood
improvingtechnology to increasecarryingcapacity havinga meat riendiet
importingmoreresourcesfromothercountries
reducing its population toreduceresourceuse
usingtechnology tointensifylanduse
calculatingecologicalfootprint
Ecologicalfootprint calculationsinclude
bioproductiveand currentlyused andused forfoodandmaterialssuch asfarmland gardenspastureandmanagedforest
bioproductivesea the seaareaused forhumanconsumption
energyland an equivalentamountofland that wouldberequired to supportrenewableenergy instead of nonrenewableenergy
builtconsumed land landusedfordevelopmentsuchasroadsandbuildings
I biodiversity land landrequired tosupport an nonhumanspecies
team eaamaaai.ae
land on waterrequired to provideaquaticandatmosphericresources
iii aa.ie
aIi ea
replacement of productive land lost throughurbanization
Ecologicalfootprints in Hics and Lies
Liestend to havesmallerecologicalfootprints than Hies
muchsmaller rates ofresource consumption
Hics peoplehavemoredisposableincome consumptionanddemandforenergyresources is high
produce farmorewaste
meat
eatingdiet requirestheuse ofmoreland than a vegetarian diet
Greenhouse emissions affectecologicalfootprints
agriculturesectoremitsbetween 5.1andonebilliontonnes of greenhouse gasesannually
m.mn
iiiiiiii sionaln ectares
Ic
msn su
iqpacity
deficitin reserve as i gna
fiiiiiiiiiiiiiiii
Biocapacity person in gna
Global trends in consumption
povertyreduction and the globalmiddle class
aao around son of population in lowincomecountries ines livedon 1.25 a day
in 2015 it was around 14.1
Absolutepoverty
in 1990 i abillionpeoplelived in extremepoverty
in2015836millionpeoplelived in extreme poverty
middleclassairing on at least 4day
Almostt ripledbetween aao and 2015
increase in averageincomes and the tail in peoplelivingin absolutepoverty increase innumber of middleclasspeople
in 2009 around 1.8billionmiddleclasspeople
Europe 664million
iii main
middlec lass importanteconomicfeature helpsincreasesalesofgoods e.gelectricalg oodsmobilephonesandcars
em mentation men mention
manypeople on incomes over 4 dayremain vulnerable to unemployment and underemployment
informal activities line to no security
socioeconomic factors influencingsocialclasses
peopleare disadvantaged on account of theirgenderethnicitydisabilityand geographical location
e g in latinamericawomenaremorelikely to live in poverty than men
ratio of poorwomen poormen 108 100 in mat 117 100 in 2012
Globallyabout751 ofmen are part of thegloball abourfacewhereasonly 50 ofwomenare part of thegloballaborforce
onaveragewomenearn 25 lessthan men on average
Global consumption of resources
Ecologicalfootprints hypotheticala reaoflandrequiredby a society agroupor anindividual tofulfill an their resourceneeds and assimilate
antheirwastes measured inglobaln ectaresigna
Acountrydescribedas havingan ecological footprintof 3.2 its own geographicalarea is consumingresourcesand assimilating its
wastes on ascale that wouldrequire a land 3.2 largerthan the actualsize of the country
theirland area arelivingbeyond sustainable limits
can I iiit.itim iaiingian
Allowdirectcomparisons betweengroupsand individuals
legwas vs ties keystat
1.3gnalandavailableperperson for the population of the earth
Thereis anestimate of
v N estimatesby2030we winneedthe equivalent of 2 earns to supply the world's population with an the resources it wants
country candecrease its ecologicalfootprintby A countryincreases its ecologicalfootprintby
reducing theamountsof resources ituses relyingheavilyonfossilfuels
recyclingresources increasing its use oftechnologyandthereforeenergy
, reusingresources highlevelsofimportedresourcesinigntransportcosts
improvingoneexicencyofresourceuse largepercapitaproduction ofcarso nwasteinignenergyuse
reducingthe amount of pollution it produces highfossilfuelsuses
waste to othercountries todealwith
transporting largeperc apitaconsumptionoffood
improvingtechnology to increasecarryingcapacity havinga meat riendiet
importingmoreresourcesfromothercountries
reducing its population toreduceresourceuse
usingtechnology tointensifylanduse
calculatingecologicalfootprint
Ecologicalfootprint calculationsinclude
bioproductiveand currentlyused andused forfoodandmaterialssuch asfarmland gardenspastureandmanagedforest
bioproductivesea the seaareaused forhumanconsumption
energyland an equivalentamountofland that wouldberequired to supportrenewableenergy instead of nonrenewableenergy
builtconsumed land landusedfordevelopmentsuchasroadsandbuildings
I biodiversity land landrequired tosupport an nonhumanspecies
team eaamaaai.ae
land on waterrequired to provideaquaticandatmosphericresources
iii aa.ie
aIi ea
replacement of productive land lost throughurbanization
Ecologicalfootprints in Hics and Lies
Liestend to havesmallerecologicalfootprints than Hies
muchsmaller rates ofresource consumption
Hics peoplehavemoredisposableincome consumptionanddemandforenergyresources is high
produce farmorewaste
meat
eatingdiet requirestheuse ofmoreland than a vegetarian diet
Greenhouse emissions affectecologicalfootprints
agriculturesectoremitsbetween 5.1andonebilliontonnes of greenhouse gasesannually
m.mn
iiiiiiii sionaln ectares
Ic
msn su
iqpacity
deficitin reserve as i gna
fiiiiiiiiiiiiiiii
Biocapacity person in gna