ANALYSE STATISTISCH VERBAND BIVARIATE STATISTIEK
= verbanden tussen 2 variabelen
rekening houden met meetniveau:
- 2 categorische: kruistabel
- 2 metrische: correlatiecoëfficiënt
- 1 categorische & 1 metrische: Compare Means/ variantieanalyse (ANOVA)
Statistisch verband:
Indien het mogelijk is om adhv de voorkennis vd waarde ve eenheid op 1 variabele de waarde te
voorspelen op de andere variabele
hoe sterker verband, hoe groter de kans dat de waarde op de tweede variabele correct kan
worden voorspeld
≠ causaal verband
belang van onderscheid tussen categorische en metrische variabelen
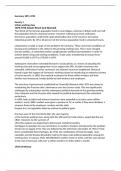
- Kruistabel (2 categorische)
2x2 tabel
Als de marginale en conditionele verdeling overeen komen, is er geen verband tussen de
variabelen: Statistische onafhankelijkheid
- Marginale verdeling: univariabel, houden geen rekening met de waarden vd andere
variabelen
- Conditionele verdeling: verdeling als er aan een conditie voldaan is
naar de relatieve frequenties kijken!
Analyse/Descriptive Statistics/Crosstabs
‘Statistics’: Phil and Cramer’s V (kijkt in welke mate er een verband is tss…)
‘Cell Display’: Observed & Row/Column/Total (rij-, kolom- of/en totale percentages)
Belangrijk bij verband: significantie & grootte populatie
<0.050: significant
>0.050: niet significant
Phi-waarde: bij 2x2 tabellen
Camer’s V: alle andere tabellen
in kleine groepen is sterkte verband belangrijk want toeval kan veel grotere gevolgen
hebben dan bij grotere populatie
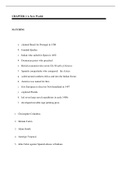
- Correlatie (2 metrische)
verband weergeven tss variabelen obv een punt/waarneming
perfect verband (:perfect te voorspellen wat waarde op x-as zal zijn als je waarde op y-as
kent en omgekeerd) / statistische onafhankelijkheid
negatieve correlatie: als de ene variabele stijgt, daalt de andere
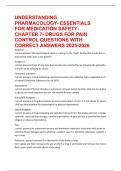
Pearson correlatie
r= +1.0 strikt positief
+0.8 positief
0 geen
-0.8 negatief
-1.0 strikt negatief
Analyse/Correlate/Bivariate
Pearson
= verbanden tussen 2 variabelen
rekening houden met meetniveau:
- 2 categorische: kruistabel
- 2 metrische: correlatiecoëfficiënt
- 1 categorische & 1 metrische: Compare Means/ variantieanalyse (ANOVA)
Statistisch verband:
Indien het mogelijk is om adhv de voorkennis vd waarde ve eenheid op 1 variabele de waarde te
voorspelen op de andere variabele
hoe sterker verband, hoe groter de kans dat de waarde op de tweede variabele correct kan
worden voorspeld
≠ causaal verband
belang van onderscheid tussen categorische en metrische variabelen
- Kruistabel (2 categorische)
2x2 tabel
Als de marginale en conditionele verdeling overeen komen, is er geen verband tussen de
variabelen: Statistische onafhankelijkheid
- Marginale verdeling: univariabel, houden geen rekening met de waarden vd andere
variabelen
- Conditionele verdeling: verdeling als er aan een conditie voldaan is
naar de relatieve frequenties kijken!
Analyse/Descriptive Statistics/Crosstabs
‘Statistics’: Phil and Cramer’s V (kijkt in welke mate er een verband is tss…)
‘Cell Display’: Observed & Row/Column/Total (rij-, kolom- of/en totale percentages)
Belangrijk bij verband: significantie & grootte populatie
<0.050: significant
>0.050: niet significant
Phi-waarde: bij 2x2 tabellen
Camer’s V: alle andere tabellen
in kleine groepen is sterkte verband belangrijk want toeval kan veel grotere gevolgen
hebben dan bij grotere populatie
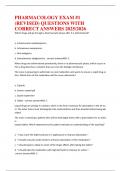
- Correlatie (2 metrische)
verband weergeven tss variabelen obv een punt/waarneming
perfect verband (:perfect te voorspellen wat waarde op x-as zal zijn als je waarde op y-as
kent en omgekeerd) / statistische onafhankelijkheid
negatieve correlatie: als de ene variabele stijgt, daalt de andere
Pearson correlatie
r= +1.0 strikt positief
+0.8 positief
0 geen
-0.8 negatief
-1.0 strikt negatief
Analyse/Correlate/Bivariate
Pearson