GLOSSARY
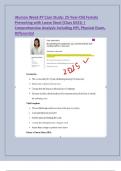
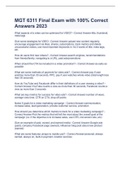
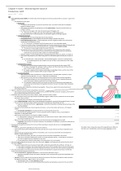
Crust: varies in thickness – beneath the ocean it I sonly 6-10km thick but below the con nents 30-70km.
Mohorovicic discon nuity – sharp divide forming the boundary between the upper mantle and the crust.
Lithosphere – consists of the crust and the rigid upper sec on of the mantle. Approximately 80-90km thick.
This is the sec on of the earth that is divided into 7 large plates and several smaller ones. Located above the
asthenosphere.
Asthenosphere – lies beneath the lithosphere. It is semi-molten on which the plates float and move.
Mantle – made up of molten and semi-molten rocks containing lighter elements such as silicon and oxygen.
Outer core – made up of dense rocks containing iron and nickel alloys. It is molten.
Inner Core – made up of dense rocks containing iron and nickel alloys. It is solid, with a temperature over
5000 C. This heat is produced mainly as the result of primordial heat le/ over form the Earths forma on and
radiogenic heat produced by the radioac ve decay of isotopes e.g., uranium, potassium.
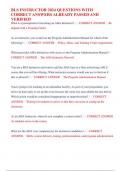
Convec on currents – as semi molten rock in the mantle is heated it becomes less dense than its
surroundings and rises. As it reaches the crust above, it spreads out carrying the plate above it with it as the
semi-molten rock cools it gradually sinks back down to be reheated.
Ridge push – the molten magma that rises at a mid-ocean ridge is very hot and heats the rock around it. As
the asthenosphere and lithosphere at the ridge are heated, they expand and become elevated above the
surrounding sea floor. This eleva on produces a slope downwards and away from the ridge. Because the rock
that forms from the magma is very hot at first it is less dense and more buoyant than the rocks farther away
from the midocean ridge. However, as the newly formed rock cools it becomes denser. Gravity then causes
this older, denser lithosphere to slide away from the ridge, down the sloping asthenosphere. As the older,
denser lithosphere slides away, new molten magma wells up at the mid-ocean ridge, eventually becoming
anew lithosphere.
Slab pull – at a subduc on boundary, one plate is denser and heavier than the other. This denser heavier
plate begins to subduct beneath the plate that is less dense. The edge of the subduc ng plate is much colder
and heavier than the mantle, so it con nues to sink pulling the rest of the plate along with it.
, HAZARDS - Geography notes typed up.
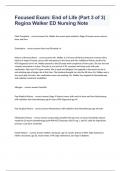
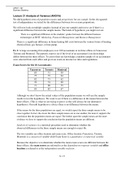
A NATURAL HAZARD is a perceived natural event that poses a threat to human environment e.g. to life and/
or property.
A NATURAL DISASTER is when a natural hazard causes
severe damage to human ac vi es- major loss of life,
injury, damage to property, disrup on to economic
ac vi es etc.
Human
Natural events/
Systems (e.g. PERCEPTION: the way in which an individual or a
physical HAZARD
transport, group view the threat if a hazard event.
processes.
settelments)
The UN declares a natural hazard when:
10+ people are killed.
100+ people are affected.
A state of emergency is declared.
A natural disaster is when the impact of an event “exceeds the Interna onal assistance is called for.
Ability of the affected community or society to cope using its resources”.
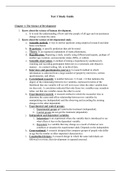
WHAT MAKES A PERSON/COMMUNITY MORE VULNERABLE?
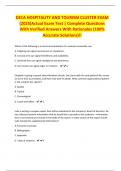
GEOPHYSICAL:
Loca on (distance from event)
Infrastructure- healthcare Caused by earth processes.
They can be caused by internal earth
Building Quality
processes of tectonic ac vity or by
Age
external processes of
Popula on density geomorphological origin involving
Level of economic development mass movement.
Warning systems in place?
RISK is the exposure of people to hazardous events that ATMOSPHERIC:
may impact themselves or their built environment. Processes opera ng in the atmosphere
resul ng in extreme weather or
GEOPHYSICAL ATMOSPHERIC HYDROLOGICAL atmospheric condi ons.
earthquakes Tropical storms avalanches
volcanoes e.g. tornados Storm surges HYDROLOGICAL:
mudslides e.g. cyclones drought
Caused by the occurrence, movement,
rockfalls Sandstorms Coastal flooding
and distribu on of surface and
tsunamis Hailstorms River flooding underground water.
Lightening
HAZARD RSIK, PERCEPTION, AND VULNERABILITY
Why live in hazardous areas?
Lack of alterna ves- economic (money, employment, land), social (homes, family)
Cost/benefit- advantages outweigh risk e.g. in Iceland.
Changing level of risk- deforesta on, flooding, landslides.
Hazards are unpredictable.
, Percep on- safe/ God’s will/ adapt.
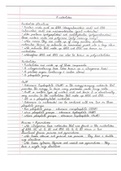
ACCECTABLE RISK: the level of poten al losses that a society or community considers acceptable given
exis ng social, economic, poli cal,
cultural, technical, and
environmental condi ons.
R=(HxV)/CC
Level of Risk= frequency and
magnitude of hazard x
Vulnerability/ Capacity to cope
People in poorer ci es/ urban
areas are more at risk, more
vulnerable.
As some urban areas have
expanded, more people have been
forced to live in hazardous areas.
Percep on is influenced by factors such as:
Socioeconomic status
Level of educa on
Occupa on/employment status
Religion, cultural/ethnic background
Family and marital status
Past experiences
Values, personality, and expecta ons
MANAGEMENT OF NATURAL HAZARDS:
MANAGEMENT: Ways to reduce risk. Responses can come from individuals, within and between local
communi es and from na onal government (CORBRA) and interna onal agencies ( UNITED NATIONS,
OXFAM).
PREDICTION: possible to give warnings- key here is monitoring. NATIONAL HURRICANE CENTRE in
Florida- uses informa on from satellites and land, sea, and air-based recordings.
PREVENTION- Unrealis c! Some schemes do exist, however.
PROTECTION: Involves modifica on to built environment.
Community Preparedness/ Risk Sharing is a key element.
Prearranged measures that aim to reduce loss of life and property damage through public
educa on and awareness programmes, evacua on procedures and the provision of emergency
medical and food supplies and shelters.
Can also be aQempts to modify losses through insurance (richer areas), and interna onal aid
(poorer areas).
VULNERABILITY TO ENVIRONMENTAL HAZARDS – SUSAN L CUTTER WIDER READING NOTES.
, Vulnerability assessments are used to determine the poten al damage and loss of life from extreme natural
events. They are important in proposing hazard reduc on alterna ves. Vulnerability is broadly defined as
the poten al for loss. There is personal or individual poten al for loss – INDIVIDUAL VULNERABILITY.
SOCIAL VULNERABILITY is the suscep bility of social groups or society at large to poten al loss.
BIOPHYSICAL VULNERABILITY is the poten al for loss goQen from the interac on of society with biophysical
condi ons which affect the resilience of the environment to respond to a hazard as well as influencing the
adapta on of society to changing condi ons. The distribu on of hazardous condi ons, the human
occupancy of hazardous zone (e.g., floodplains, seismic zones, or coastal areas) and the degree of loss all
influence vulnerability studies, as well as the magnitude, dura on, impact and frequency and rapidity of
onset of the hazard characterise the vulnerability studies.
Vulnerability has mul ple defini ons and factors that affect it. In some cases, vulnerability focuses on the
coping response and societal resistance and resilience to hazards. Vulnerability is rooted in historical,
cultural, social, and economic processes that have an affect on the individual or a society’s ability to cope
with disasters and adequately respond to them. Whilst involves both the biophysical risk as well as the
social response, it is also impacted by the specific areal or geographical domain a hazard occurs in.
GEOGRAPHIC SPACE- where vulnerable people and places are located.
SOCIAL SPACE- who in those places are most vulnerable.
Since there is liQle consistency in the defini on of vulnerability, measurement and assessment techniques
are far easier tasks. Variables related to exposure normally include proximity to the source of the threat,
incident frequency or probability, magnitude, dura on, or spa al impact. Social impact and response are
usually measured by threats to lifelines or infrastructure to support basic needs, special needs popula ons,
poverty/wealth indicators, gender, race etc. Vulnerability indicators are usually single variables but
mul dimensional factors such as food aid, ins tu onal development, social rela ons, or poli cal power are
also measurements of vulnerability. Geographical scale impacts the measurement of vulnerability, is it on a
local scale/global scale. The temporal context of vulnerability is also a crucial factor in its measurement but
tends to be one if the least studied aspects.
CASUAL LINKAGES AND SPATIAL OUTCOMES: most of the vulnerability studies take a poli cal-economic
perspec ve and suggest a casual structure that concentrates on different social impacts and ability to cope
with the hazard.
O/en the cause of social vulnerability is underlying social condi ons – WaQs and Bohle – analysis of hunger
and famine - vulnerability defined by 3 processes: en tlement (economic capability), empowerment
(poli cal/social power) and poli cal economy.
Blaikie- pressure and release model and access to resources model. PAR- gives an explana on to the
rela onship between processes that give rise to unsafe condi ons and their intersec on with some type of
hazard. Forms social vulnerability. The accesses to resources model - an explana on of the role of poli cal
and economic forces that act as the toot cause of unsafe condi ons.
CAUSALITY- the rela onship between cause and effect. Vulnerability is primarily a result of the proximity to
the source of the risk. PALM and HODGSON’s work on seismic mapping in rela on to earthquake insurance
is a good example of how to reduce vulnerability. . Vulnerability assessments are used to describe,
characterise, and assess the hazard, looking towards the development of some mi ga on strategies. .
USFEMA’s floodplain mapping is an example of simple vulnerability assessments. OAS developed a series of
mul hazard maps that incorporate vulnerability assessments into preimpact planning and mi ga on
efforts. Ther assessments include human popula ons, cri cal facili es and lifelines, economic produc on
Crust: varies in thickness – beneath the ocean it I sonly 6-10km thick but below the con nents 30-70km.
Mohorovicic discon nuity – sharp divide forming the boundary between the upper mantle and the crust.
Lithosphere – consists of the crust and the rigid upper sec on of the mantle. Approximately 80-90km thick.
This is the sec on of the earth that is divided into 7 large plates and several smaller ones. Located above the
asthenosphere.
Asthenosphere – lies beneath the lithosphere. It is semi-molten on which the plates float and move.
Mantle – made up of molten and semi-molten rocks containing lighter elements such as silicon and oxygen.
Outer core – made up of dense rocks containing iron and nickel alloys. It is molten.
Inner Core – made up of dense rocks containing iron and nickel alloys. It is solid, with a temperature over
5000 C. This heat is produced mainly as the result of primordial heat le/ over form the Earths forma on and
radiogenic heat produced by the radioac ve decay of isotopes e.g., uranium, potassium.
Convec on currents – as semi molten rock in the mantle is heated it becomes less dense than its
surroundings and rises. As it reaches the crust above, it spreads out carrying the plate above it with it as the
semi-molten rock cools it gradually sinks back down to be reheated.
Ridge push – the molten magma that rises at a mid-ocean ridge is very hot and heats the rock around it. As
the asthenosphere and lithosphere at the ridge are heated, they expand and become elevated above the
surrounding sea floor. This eleva on produces a slope downwards and away from the ridge. Because the rock
that forms from the magma is very hot at first it is less dense and more buoyant than the rocks farther away
from the midocean ridge. However, as the newly formed rock cools it becomes denser. Gravity then causes
this older, denser lithosphere to slide away from the ridge, down the sloping asthenosphere. As the older,
denser lithosphere slides away, new molten magma wells up at the mid-ocean ridge, eventually becoming
anew lithosphere.
Slab pull – at a subduc on boundary, one plate is denser and heavier than the other. This denser heavier
plate begins to subduct beneath the plate that is less dense. The edge of the subduc ng plate is much colder
and heavier than the mantle, so it con nues to sink pulling the rest of the plate along with it.
, HAZARDS - Geography notes typed up.
A NATURAL HAZARD is a perceived natural event that poses a threat to human environment e.g. to life and/
or property.
A NATURAL DISASTER is when a natural hazard causes
severe damage to human ac vi es- major loss of life,
injury, damage to property, disrup on to economic
ac vi es etc.
Human
Natural events/
Systems (e.g. PERCEPTION: the way in which an individual or a
physical HAZARD
transport, group view the threat if a hazard event.
processes.
settelments)
The UN declares a natural hazard when:
10+ people are killed.
100+ people are affected.
A state of emergency is declared.
A natural disaster is when the impact of an event “exceeds the Interna onal assistance is called for.
Ability of the affected community or society to cope using its resources”.
WHAT MAKES A PERSON/COMMUNITY MORE VULNERABLE?
GEOPHYSICAL:
Loca on (distance from event)
Infrastructure- healthcare Caused by earth processes.
They can be caused by internal earth
Building Quality
processes of tectonic ac vity or by
Age
external processes of
Popula on density geomorphological origin involving
Level of economic development mass movement.
Warning systems in place?
RISK is the exposure of people to hazardous events that ATMOSPHERIC:
may impact themselves or their built environment. Processes opera ng in the atmosphere
resul ng in extreme weather or
GEOPHYSICAL ATMOSPHERIC HYDROLOGICAL atmospheric condi ons.
earthquakes Tropical storms avalanches
volcanoes e.g. tornados Storm surges HYDROLOGICAL:
mudslides e.g. cyclones drought
Caused by the occurrence, movement,
rockfalls Sandstorms Coastal flooding
and distribu on of surface and
tsunamis Hailstorms River flooding underground water.
Lightening
HAZARD RSIK, PERCEPTION, AND VULNERABILITY
Why live in hazardous areas?
Lack of alterna ves- economic (money, employment, land), social (homes, family)
Cost/benefit- advantages outweigh risk e.g. in Iceland.
Changing level of risk- deforesta on, flooding, landslides.
Hazards are unpredictable.
, Percep on- safe/ God’s will/ adapt.
ACCECTABLE RISK: the level of poten al losses that a society or community considers acceptable given
exis ng social, economic, poli cal,
cultural, technical, and
environmental condi ons.
R=(HxV)/CC
Level of Risk= frequency and
magnitude of hazard x
Vulnerability/ Capacity to cope
People in poorer ci es/ urban
areas are more at risk, more
vulnerable.
As some urban areas have
expanded, more people have been
forced to live in hazardous areas.
Percep on is influenced by factors such as:
Socioeconomic status
Level of educa on
Occupa on/employment status
Religion, cultural/ethnic background
Family and marital status
Past experiences
Values, personality, and expecta ons
MANAGEMENT OF NATURAL HAZARDS:
MANAGEMENT: Ways to reduce risk. Responses can come from individuals, within and between local
communi es and from na onal government (CORBRA) and interna onal agencies ( UNITED NATIONS,
OXFAM).
PREDICTION: possible to give warnings- key here is monitoring. NATIONAL HURRICANE CENTRE in
Florida- uses informa on from satellites and land, sea, and air-based recordings.
PREVENTION- Unrealis c! Some schemes do exist, however.
PROTECTION: Involves modifica on to built environment.
Community Preparedness/ Risk Sharing is a key element.
Prearranged measures that aim to reduce loss of life and property damage through public
educa on and awareness programmes, evacua on procedures and the provision of emergency
medical and food supplies and shelters.
Can also be aQempts to modify losses through insurance (richer areas), and interna onal aid
(poorer areas).
VULNERABILITY TO ENVIRONMENTAL HAZARDS – SUSAN L CUTTER WIDER READING NOTES.
, Vulnerability assessments are used to determine the poten al damage and loss of life from extreme natural
events. They are important in proposing hazard reduc on alterna ves. Vulnerability is broadly defined as
the poten al for loss. There is personal or individual poten al for loss – INDIVIDUAL VULNERABILITY.
SOCIAL VULNERABILITY is the suscep bility of social groups or society at large to poten al loss.
BIOPHYSICAL VULNERABILITY is the poten al for loss goQen from the interac on of society with biophysical
condi ons which affect the resilience of the environment to respond to a hazard as well as influencing the
adapta on of society to changing condi ons. The distribu on of hazardous condi ons, the human
occupancy of hazardous zone (e.g., floodplains, seismic zones, or coastal areas) and the degree of loss all
influence vulnerability studies, as well as the magnitude, dura on, impact and frequency and rapidity of
onset of the hazard characterise the vulnerability studies.
Vulnerability has mul ple defini ons and factors that affect it. In some cases, vulnerability focuses on the
coping response and societal resistance and resilience to hazards. Vulnerability is rooted in historical,
cultural, social, and economic processes that have an affect on the individual or a society’s ability to cope
with disasters and adequately respond to them. Whilst involves both the biophysical risk as well as the
social response, it is also impacted by the specific areal or geographical domain a hazard occurs in.
GEOGRAPHIC SPACE- where vulnerable people and places are located.
SOCIAL SPACE- who in those places are most vulnerable.
Since there is liQle consistency in the defini on of vulnerability, measurement and assessment techniques
are far easier tasks. Variables related to exposure normally include proximity to the source of the threat,
incident frequency or probability, magnitude, dura on, or spa al impact. Social impact and response are
usually measured by threats to lifelines or infrastructure to support basic needs, special needs popula ons,
poverty/wealth indicators, gender, race etc. Vulnerability indicators are usually single variables but
mul dimensional factors such as food aid, ins tu onal development, social rela ons, or poli cal power are
also measurements of vulnerability. Geographical scale impacts the measurement of vulnerability, is it on a
local scale/global scale. The temporal context of vulnerability is also a crucial factor in its measurement but
tends to be one if the least studied aspects.
CASUAL LINKAGES AND SPATIAL OUTCOMES: most of the vulnerability studies take a poli cal-economic
perspec ve and suggest a casual structure that concentrates on different social impacts and ability to cope
with the hazard.
O/en the cause of social vulnerability is underlying social condi ons – WaQs and Bohle – analysis of hunger
and famine - vulnerability defined by 3 processes: en tlement (economic capability), empowerment
(poli cal/social power) and poli cal economy.
Blaikie- pressure and release model and access to resources model. PAR- gives an explana on to the
rela onship between processes that give rise to unsafe condi ons and their intersec on with some type of
hazard. Forms social vulnerability. The accesses to resources model - an explana on of the role of poli cal
and economic forces that act as the toot cause of unsafe condi ons.
CAUSALITY- the rela onship between cause and effect. Vulnerability is primarily a result of the proximity to
the source of the risk. PALM and HODGSON’s work on seismic mapping in rela on to earthquake insurance
is a good example of how to reduce vulnerability. . Vulnerability assessments are used to describe,
characterise, and assess the hazard, looking towards the development of some mi ga on strategies. .
USFEMA’s floodplain mapping is an example of simple vulnerability assessments. OAS developed a series of
mul hazard maps that incorporate vulnerability assessments into preimpact planning and mi ga on
efforts. Ther assessments include human popula ons, cri cal facili es and lifelines, economic produc on