AQA Economics Paper 1, Specimen 2015
Ella Bicknell (examiner comments by Peter Cramp)
Context 1
0 1
% change = - (7.1m – 6.5m)/7.1m x 100 = - 8.45 (2DP)
Answer: - 8.45%
Ella’s answer is correct so scores 2/2. Common errors to avoid include forgetting to include
the % sign or not rounding to the two decimal places required in the question. These errors
would both result in a mark of 1/2, as would an answer of 8.45% as this neglects to include
the negative sign.
Some students might also use the data from the wrong row of the table. In this question, it
is important to remember to use the “membership” figures rather than the row of the table
for density. Be careful to calculate the change as a percentage of the original value of 7.1m
not the new value of 6.5m.
1
,AQA Economics Paper 1, Specimen 2015
Ella Bicknell (examiner comments by Peter Cramp)
0 2
Union density has fallen from 32.4% to 26.0% between 1995 and 2012. This suggests the
declining importance of trade unions in the UK labour market as it means that a smaller
percentage of the workforce are union members. This means that unions will have less
control over the supply of labour and therefore less ability to raise wages.
Ella’s answer scores 4/4. She has picked out a key feature from the data to support the
proposition in the question and supported it with dates and numbers. Importantly, she has
given an overview of the period by quoting data from both 1995 and 2012, but nothing in
between.
The 4 mark question often requires students to do some simple analysis to explain why the
key feature selected supports the proposition in the question. This is the approach that Ella
has taken here when she explains that lower union density means that unions have less
control over the supply of labour. It is an approach that has worked well.
2
,AQA Economics Paper 1, Specimen 2015
Ella Bicknell (examiner comments by Peter Cramp)
0 3
A monopsonist employer is the sole employer of a particular type of labour. One example is
the NHS which is a near monopsonist employer of nurses with only a small number
employed by private hospitals.
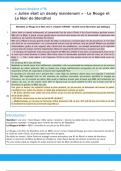
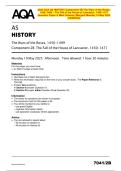
In a competitive labour market, quantity of workers employed and their wages are
determined by demand and supply forces (Figure 1: S=D at Qc and Wc). However, under a
monopsony, workers have no other employers they could work for, giving the monopsony
wage making power. Also, the marginal cost of labour curve is above the average costs of
labour curve because the marginal cost of adding an extra worker is more than the average
cost as you will have to raise the wages of all workers to hire an extra worker. A monopsony
will set employment at the profit maximising level where marginal revenue product is equal
to the marginal cost of labour (Point A is when MCL=MRP). Therefore, the quantity of
workers employed is QM. This makes the wage WM.
Thus employment and wages are suppressed below the equilibrium unless a strong Trade
Union has countervailing power. This is why a monopsony labour market is described as a
demand side imperfection of the labour market.
Figure 1: Diagram to show the effect
the NHS has, as a monopsony
employer, on wages and
employment of nurses
3
, AQA Economics Paper 1, Specimen 2015
Ella Bicknell (examiner comments by Peter Cramp)
The skills required for answering a 9 marker are knowledge, analysis and application and all
should be in evidence to reach the top level (Level 3) To score top marks there must be a
relevant diagram that is used accurately and appropriately (itself evidence of application)
Ella’s answer is a Level 3 answer, and is most likely to score 9/9. Her analysis is clear and
correct throughout, which is impressive given the technical nature of this area. The diagram
is likewise correct and the title is helpful in that it applies theory to the specific context of the
example of the NHS as a monopsony employer.
Ella might have chosen to explain why MCL = MRP is the profit maximising condition for the
number of workers to employ and why WM is the corresponding wage (read from QM to the
supply curve) but this concise and clear answer would still stand out.
4
Ella Bicknell (examiner comments by Peter Cramp)
Context 1
0 1
% change = - (7.1m – 6.5m)/7.1m x 100 = - 8.45 (2DP)
Answer: - 8.45%
Ella’s answer is correct so scores 2/2. Common errors to avoid include forgetting to include
the % sign or not rounding to the two decimal places required in the question. These errors
would both result in a mark of 1/2, as would an answer of 8.45% as this neglects to include
the negative sign.
Some students might also use the data from the wrong row of the table. In this question, it
is important to remember to use the “membership” figures rather than the row of the table
for density. Be careful to calculate the change as a percentage of the original value of 7.1m
not the new value of 6.5m.
1
,AQA Economics Paper 1, Specimen 2015
Ella Bicknell (examiner comments by Peter Cramp)
0 2
Union density has fallen from 32.4% to 26.0% between 1995 and 2012. This suggests the
declining importance of trade unions in the UK labour market as it means that a smaller
percentage of the workforce are union members. This means that unions will have less
control over the supply of labour and therefore less ability to raise wages.
Ella’s answer scores 4/4. She has picked out a key feature from the data to support the
proposition in the question and supported it with dates and numbers. Importantly, she has
given an overview of the period by quoting data from both 1995 and 2012, but nothing in
between.
The 4 mark question often requires students to do some simple analysis to explain why the
key feature selected supports the proposition in the question. This is the approach that Ella
has taken here when she explains that lower union density means that unions have less
control over the supply of labour. It is an approach that has worked well.
2
,AQA Economics Paper 1, Specimen 2015
Ella Bicknell (examiner comments by Peter Cramp)
0 3
A monopsonist employer is the sole employer of a particular type of labour. One example is
the NHS which is a near monopsonist employer of nurses with only a small number
employed by private hospitals.
In a competitive labour market, quantity of workers employed and their wages are
determined by demand and supply forces (Figure 1: S=D at Qc and Wc). However, under a
monopsony, workers have no other employers they could work for, giving the monopsony
wage making power. Also, the marginal cost of labour curve is above the average costs of
labour curve because the marginal cost of adding an extra worker is more than the average
cost as you will have to raise the wages of all workers to hire an extra worker. A monopsony
will set employment at the profit maximising level where marginal revenue product is equal
to the marginal cost of labour (Point A is when MCL=MRP). Therefore, the quantity of
workers employed is QM. This makes the wage WM.
Thus employment and wages are suppressed below the equilibrium unless a strong Trade
Union has countervailing power. This is why a monopsony labour market is described as a
demand side imperfection of the labour market.
Figure 1: Diagram to show the effect
the NHS has, as a monopsony
employer, on wages and
employment of nurses
3
, AQA Economics Paper 1, Specimen 2015
Ella Bicknell (examiner comments by Peter Cramp)
The skills required for answering a 9 marker are knowledge, analysis and application and all
should be in evidence to reach the top level (Level 3) To score top marks there must be a
relevant diagram that is used accurately and appropriately (itself evidence of application)
Ella’s answer is a Level 3 answer, and is most likely to score 9/9. Her analysis is clear and
correct throughout, which is impressive given the technical nature of this area. The diagram
is likewise correct and the title is helpful in that it applies theory to the specific context of the
example of the NHS as a monopsony employer.
Ella might have chosen to explain why MCL = MRP is the profit maximising condition for the
number of workers to employ and why WM is the corresponding wage (read from QM to the
supply curve) but this concise and clear answer would still stand out.
4