lOMoAR cPSD| 47061011
2/18 that's 11%
RETAKE THIS PRACTICE MILESTONE
1
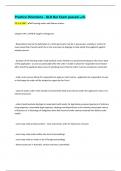
James takes two data points from the weight and feed cost data set to calculate a slope, or average rate of change. A
hamster weighs 3 pounds and costs $3.50 per week to feed, while a Chihuahua weighs 4.8 pounds and costs $6.20 per week
to feed.
Using weight as the explanatory variable, what is the slope of the line between these two points? Answer choices are
rounded to the nearest hundredth.
$2.80 / lb.
1.50 / lb.
$0.67 / lb.
$0.36 / lb.
RATIONALE
In order to get slope, we can use the formula: . Using the information provided, the two points are: (3
lb., $3.50) and (4.8 lb., $6.20). We can note that:
, lOMoAR cPSD| 47061011
Report an issue with this questionCONCEPT
Linear Equation Algebra Review
2
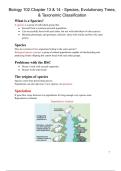
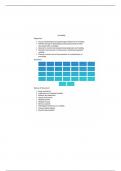
This scatterplot shows the performance of a pressure sensor using two variables, pressure and voltage
The equation for the least-squares regression line to this data set is
The predicted value for the voltage for a pressure of 50 MPa is __________.
2580 mV
lOMoAR cPSD| 47061011
, 2560 mV
2502 mV
2582 mV
RATIONALE
In order to get the predicted voltage when the pressure is 50 MPA, we simply substitute the value 50 in our equation for x. So
we can note that:
CONCEPT
Predictions from Best-Fit Lines
Report an issue with this question
3
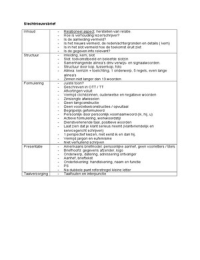
This scatterplot shows the performance of a pressure sensor using two variables, pressure and voltage
Which answer choice correctly indicates the explanatory variable and the response variable of the scatterplot?
2/18 that's 11%
RETAKE THIS PRACTICE MILESTONE
1
James takes two data points from the weight and feed cost data set to calculate a slope, or average rate of change. A
hamster weighs 3 pounds and costs $3.50 per week to feed, while a Chihuahua weighs 4.8 pounds and costs $6.20 per week
to feed.
Using weight as the explanatory variable, what is the slope of the line between these two points? Answer choices are
rounded to the nearest hundredth.
$2.80 / lb.
1.50 / lb.
$0.67 / lb.
$0.36 / lb.
RATIONALE
In order to get slope, we can use the formula: . Using the information provided, the two points are: (3
lb., $3.50) and (4.8 lb., $6.20). We can note that:
, lOMoAR cPSD| 47061011
Report an issue with this questionCONCEPT
Linear Equation Algebra Review
2
This scatterplot shows the performance of a pressure sensor using two variables, pressure and voltage
The equation for the least-squares regression line to this data set is
The predicted value for the voltage for a pressure of 50 MPa is __________.
2580 mV
lOMoAR cPSD| 47061011
, 2560 mV
2502 mV
2582 mV
RATIONALE
In order to get the predicted voltage when the pressure is 50 MPA, we simply substitute the value 50 in our equation for x. So
we can note that:
CONCEPT
Predictions from Best-Fit Lines
Report an issue with this question
3
This scatterplot shows the performance of a pressure sensor using two variables, pressure and voltage
Which answer choice correctly indicates the explanatory variable and the response variable of the scatterplot?