Social Demography
Julie Maes
Chapter 1 – Introduction
What is demography?
Demography is the scientific study of population. Some even call it the mathematical study of
population, but mixed methods are increasingly gainingmomentum. Demography covers all aspects
of population: size, structure, geographic distribution, growth and decline, as well as causes and
consequences of population dynamics. Demography is closely intertwined with other disciplines such
as sociology, econom(etr)ics, political sciences, geography, (bio)statistics, epidemiology.
Why do people have children? Where do people live? Ages structures. At which moment in live do
people get children? For example.
To understand change in patterns.
Why study demography?
1) Understanding how demography shapes society
Several aspects of modern society are shaped and affected by changes in size and structure of the
population, e.g. childcare, school systems, labour markets, health care, housing markets, social
security and pension systems, voting behaviour and political systems, migration policies etc.
Awareness of demographic trends will in many cases prove relevant, even if you have no ambition of
becoming a population scientist whatsoever. For policy makers to challenge the policy. Or how many
people live in different households? This can affect the housing market.
EVERYTHING IS RELATED TO DEMOGRAPHY.
2) Demography drives our future
Population dynamics are determined by the current structure of the population (the outcomes of past
demographic trends (born and elderly)) and change (current demographic behaviours, net of
structure). Populations have a long-term memory of 80 to 100 years (e.g. age structure), so past
demographic trends will continue to shape. European societies for several decades to come.
3) The physics of social sciences
Demographic and actuarial methods have developed for over 350 years. The use of these methods in
other disciplines is pervasive: banking and insurance (live expectancy), social sciences (sociology and
social policy research, economics and econometrics, psychology, political sciences, criminology), life
sciences (medicine and biostatistics, epidemiology) or even engineering. Knowledge of demographic
methods may prove relevant for job opportunities in adjacent fields, or to transition into the study of
more advanced subjects.
Europe demographic changes (transition)
Reversal of trends established between 1880 and 1960.
Rise in age at first marriage: later home leaving, premarital cohabitation, single living. People study
longer, so they stay longer at home. Fall in proportions married. Rise in cohabitation. Rise in divorce
and an earlier divorce. Decline of remarriage following divorce and widowhood.
1
,Crude Marriage Rate (CMR) = measure the relative frequency of particular events (e.g. marriages)
within the population as a whole in a specific period of time.
You don’t always really know what is behind a graphic. Which age f.e.? It could make it difficult to
interpret. What is actually going on?
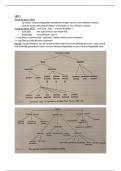
Therefore, you need to think about Demographic indicators:
Indicators that make the graphic more specific with AGE AND TIME. For example, the fertility or first
marriage tables for a given observation year show the different age-specific rates. The total rate
summarises these age-specific rates by addition. The mean age in the table for year n is the weighted
mean of the different ages, the weighting factor at age i being the rate fi at that age. A more detailed
analysis is needed to understand change in patterns of union formation (including unmarried
cohabitation) and union dissolution net of population structure, clearly distinguishing between shifts
in timing of events over the life course of individuals (tempo component) and shifts in the number of
individuals ultimately experiencing these events (quantum component).
Crude Divorce Rate (CDR) = measure the relative frequency of particular events (e.g. divorce) within
the population as a whole in a specific period of time. They are usually obtained by dividing the
number of events during a given year by the average population in that year.
Indicators the number of divorces observed in a given year will
depend on the age structure of the population, the number of
married people and many other characteristics of the population.
Fertility = The actual reproductive performance (cf. live births) of individuals, couples,
groups or populations. It is contrasted with fecundity, the theoretical capacity to reproduce, which
may or may not lead to fertility. It is actually the live births.
Transition sexual and contraceptive revolution; sex increasingly disconnected from marriage and
fertility bout of ‘shotgun marriages’. Elimination of parity failures; high abortion in former communist
countries. Rapid postponement of fertility; increasing mean age at first parenthood. Structural
subreplacement fertility (PTFR < 2.08); lowest low fertility (PTFR < 1.3), differentials in terms of
educational attainment, rising definitive childlessness in unions. Rising extra-marital fertility;
parenthood within cohabitation, persisting regional differentials.
Crude Birth Rate (CBR) = measure the relative frequency of particular events (e.g. births) within the
population as a whole in a specific period of time. In the case of annual crude rates, they are usually
obtained by dividing the number of events in a given year by the average population in that year.
Indicators mean age, years, how many children woman
eventually get (this can affect). A more detailed analysis by
birth-order is needed to understand change in patterns of
family formation net of population structure, clearly distinguishing between shifts in timing of events
over the life course of individuals (tempo component) and shifts in the number of individuals
ultimately experiencing these events (quantum component).
Fecundity = The physiological capability of a man, woman or couple to produce a live
birth. It is contrasted with fertility which is the actual reproductive performance. Reproduction live
birth (vruchtbaarheid).
2
,Epidemiological Transition = Life expectancy and healthy life
expectancy. A shift of causes of death in 1971. Latter part of 20 th century a delay of degenerative
death; reduction of risk factors (nutrition, smoking), advances in medical technology and health care
policies aimed at chronic diseases.
Crude Death Rate = measure the relative frequency of particular events (e.g. deaths) within the
population as a whole in a specific period of time. They are usually obtained by dividing the number
of events during a given year by the average population in that year. Socio-economic aspects due to
health and mortality; lower educated people do die earlier.
Indicators structure of population. Are there more elderly
people? You can use the Life table:
Demography is for policy relevant in Europe.
Less people are getting born (fertility) and people are living longer (death rate).
De size of the population is important.
Decline in birth rates and increasing life expectancy over several decades have fundamentally
affected the age structure of European societies: i) older generations survive up to
increasingly older ages while ii) younger generations have become increasingly smaller.
Forces driving population ageing in Europe = low fertility + low mortality!!!
Old age structures will continue to shape demographic trends in European societies for
decades to come, affecting virtually all aspects of society (e.g. economy and labour markets,
health care and social security, housing markets, political representation, etc.). Population
(age) structure is the long-term memory of past demographic trends. For example, the labour
market can struggle due to less people.
Due to regional variation in the speed and size of changes in fertility and mortality patterns,
the impact of these trends on age structures varies markedly between countries, resulting in
strong regional variation in the pace of population ageing.
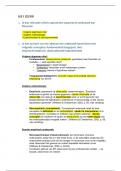
LF = labour force. Relative change in working age population (20-64) between
2015 and 2035 in case of zero migration. Only Ireland has a positive change because of the bump
with young people, these people will enter the labour market. A LF+ is a positive change, a LF– is a
negative change.
3
, Natural Growth (births – deaths per 1000
population) shows a positive or negative change. By a positive change, there are more
births than deaths. Natural growth– the excess of births over deaths– has declined in all European
countries, and net migration– the excess of immigrants over emigrants– has in many countries
become the main source of population growth since several decades.
There can be a growth, but you in some cases the growth is an effect of migration.
Rmig = the national growth versus net migration
Demographic change structural subreplacement fertility & lowest low
fertility, increasing life expectancy and changing patterns of family formation.
Consequences of demographic change
accelerated population ageing & population decline inevitable, more complex family structures,
population trends are unsustainable in long run: threath to economy, labour market & European
welfare state.
• Cohort completed fertility of cohorts born around 1960: higher than level suggested by period
indicators in 1980-1990.
• Northern & Western Europe: low marriage rates, high cohabitation, frequent divorce but
moderately high fertility levels.
• Socio-economic differentials in fertility & parity progression: higher fertility among higher educated.
• Costs for health care increase rapidly with age. Care implications of changing family structures:
personal networks/family versus state? Demise of European health care systems?
• Socio-economic differentials in health & mortality. High age does not entail poor health in case of
higher educated. Rising inequality: concern for policy?
• More complex Family Structures. Family support potential tends to increase next 20-30 years.
Potential for family support lower for cohorts born after 1950.
• Further research required. Best means to maintain supportive networks in old age. Promoting and
maintaining health, balance formal/unpaid care.
It is not easy to say what is actually going on in the future.
Population ageing and decline is a threat to economy and labor force.
Understanding European population dynamics and their precise implications requires:
A careful assessment of the factors shaping current demographic behaviours, e.g. how are
patterns of family formation of young adults shaped by their individual characteristics (e.g.
education, attitudes, migration background) as well as their social networks (e.g. peers,
family) and the wider policy and economic contexts? How many people? And what is their
profile?
While taking into consideration that population dynamics are at the same time strongly
conditioned by past demographic trends (e.g. size and composition of young generations in
terms of educational level, migration background etc.). What is the behavior of people in
their future? Trends.
4
Julie Maes
Chapter 1 – Introduction
What is demography?
Demography is the scientific study of population. Some even call it the mathematical study of
population, but mixed methods are increasingly gainingmomentum. Demography covers all aspects
of population: size, structure, geographic distribution, growth and decline, as well as causes and
consequences of population dynamics. Demography is closely intertwined with other disciplines such
as sociology, econom(etr)ics, political sciences, geography, (bio)statistics, epidemiology.
Why do people have children? Where do people live? Ages structures. At which moment in live do
people get children? For example.
To understand change in patterns.
Why study demography?
1) Understanding how demography shapes society
Several aspects of modern society are shaped and affected by changes in size and structure of the
population, e.g. childcare, school systems, labour markets, health care, housing markets, social
security and pension systems, voting behaviour and political systems, migration policies etc.
Awareness of demographic trends will in many cases prove relevant, even if you have no ambition of
becoming a population scientist whatsoever. For policy makers to challenge the policy. Or how many
people live in different households? This can affect the housing market.
EVERYTHING IS RELATED TO DEMOGRAPHY.
2) Demography drives our future
Population dynamics are determined by the current structure of the population (the outcomes of past
demographic trends (born and elderly)) and change (current demographic behaviours, net of
structure). Populations have a long-term memory of 80 to 100 years (e.g. age structure), so past
demographic trends will continue to shape. European societies for several decades to come.
3) The physics of social sciences
Demographic and actuarial methods have developed for over 350 years. The use of these methods in
other disciplines is pervasive: banking and insurance (live expectancy), social sciences (sociology and
social policy research, economics and econometrics, psychology, political sciences, criminology), life
sciences (medicine and biostatistics, epidemiology) or even engineering. Knowledge of demographic
methods may prove relevant for job opportunities in adjacent fields, or to transition into the study of
more advanced subjects.
Europe demographic changes (transition)
Reversal of trends established between 1880 and 1960.
Rise in age at first marriage: later home leaving, premarital cohabitation, single living. People study
longer, so they stay longer at home. Fall in proportions married. Rise in cohabitation. Rise in divorce
and an earlier divorce. Decline of remarriage following divorce and widowhood.
1
,Crude Marriage Rate (CMR) = measure the relative frequency of particular events (e.g. marriages)
within the population as a whole in a specific period of time.
You don’t always really know what is behind a graphic. Which age f.e.? It could make it difficult to
interpret. What is actually going on?
Therefore, you need to think about Demographic indicators:
Indicators that make the graphic more specific with AGE AND TIME. For example, the fertility or first
marriage tables for a given observation year show the different age-specific rates. The total rate
summarises these age-specific rates by addition. The mean age in the table for year n is the weighted
mean of the different ages, the weighting factor at age i being the rate fi at that age. A more detailed
analysis is needed to understand change in patterns of union formation (including unmarried
cohabitation) and union dissolution net of population structure, clearly distinguishing between shifts
in timing of events over the life course of individuals (tempo component) and shifts in the number of
individuals ultimately experiencing these events (quantum component).
Crude Divorce Rate (CDR) = measure the relative frequency of particular events (e.g. divorce) within
the population as a whole in a specific period of time. They are usually obtained by dividing the
number of events during a given year by the average population in that year.
Indicators the number of divorces observed in a given year will
depend on the age structure of the population, the number of
married people and many other characteristics of the population.
Fertility = The actual reproductive performance (cf. live births) of individuals, couples,
groups or populations. It is contrasted with fecundity, the theoretical capacity to reproduce, which
may or may not lead to fertility. It is actually the live births.
Transition sexual and contraceptive revolution; sex increasingly disconnected from marriage and
fertility bout of ‘shotgun marriages’. Elimination of parity failures; high abortion in former communist
countries. Rapid postponement of fertility; increasing mean age at first parenthood. Structural
subreplacement fertility (PTFR < 2.08); lowest low fertility (PTFR < 1.3), differentials in terms of
educational attainment, rising definitive childlessness in unions. Rising extra-marital fertility;
parenthood within cohabitation, persisting regional differentials.
Crude Birth Rate (CBR) = measure the relative frequency of particular events (e.g. births) within the
population as a whole in a specific period of time. In the case of annual crude rates, they are usually
obtained by dividing the number of events in a given year by the average population in that year.
Indicators mean age, years, how many children woman
eventually get (this can affect). A more detailed analysis by
birth-order is needed to understand change in patterns of
family formation net of population structure, clearly distinguishing between shifts in timing of events
over the life course of individuals (tempo component) and shifts in the number of individuals
ultimately experiencing these events (quantum component).
Fecundity = The physiological capability of a man, woman or couple to produce a live
birth. It is contrasted with fertility which is the actual reproductive performance. Reproduction live
birth (vruchtbaarheid).
2
,Epidemiological Transition = Life expectancy and healthy life
expectancy. A shift of causes of death in 1971. Latter part of 20 th century a delay of degenerative
death; reduction of risk factors (nutrition, smoking), advances in medical technology and health care
policies aimed at chronic diseases.
Crude Death Rate = measure the relative frequency of particular events (e.g. deaths) within the
population as a whole in a specific period of time. They are usually obtained by dividing the number
of events during a given year by the average population in that year. Socio-economic aspects due to
health and mortality; lower educated people do die earlier.
Indicators structure of population. Are there more elderly
people? You can use the Life table:
Demography is for policy relevant in Europe.
Less people are getting born (fertility) and people are living longer (death rate).
De size of the population is important.
Decline in birth rates and increasing life expectancy over several decades have fundamentally
affected the age structure of European societies: i) older generations survive up to
increasingly older ages while ii) younger generations have become increasingly smaller.
Forces driving population ageing in Europe = low fertility + low mortality!!!
Old age structures will continue to shape demographic trends in European societies for
decades to come, affecting virtually all aspects of society (e.g. economy and labour markets,
health care and social security, housing markets, political representation, etc.). Population
(age) structure is the long-term memory of past demographic trends. For example, the labour
market can struggle due to less people.
Due to regional variation in the speed and size of changes in fertility and mortality patterns,
the impact of these trends on age structures varies markedly between countries, resulting in
strong regional variation in the pace of population ageing.
LF = labour force. Relative change in working age population (20-64) between
2015 and 2035 in case of zero migration. Only Ireland has a positive change because of the bump
with young people, these people will enter the labour market. A LF+ is a positive change, a LF– is a
negative change.
3
, Natural Growth (births – deaths per 1000
population) shows a positive or negative change. By a positive change, there are more
births than deaths. Natural growth– the excess of births over deaths– has declined in all European
countries, and net migration– the excess of immigrants over emigrants– has in many countries
become the main source of population growth since several decades.
There can be a growth, but you in some cases the growth is an effect of migration.
Rmig = the national growth versus net migration
Demographic change structural subreplacement fertility & lowest low
fertility, increasing life expectancy and changing patterns of family formation.
Consequences of demographic change
accelerated population ageing & population decline inevitable, more complex family structures,
population trends are unsustainable in long run: threath to economy, labour market & European
welfare state.
• Cohort completed fertility of cohorts born around 1960: higher than level suggested by period
indicators in 1980-1990.
• Northern & Western Europe: low marriage rates, high cohabitation, frequent divorce but
moderately high fertility levels.
• Socio-economic differentials in fertility & parity progression: higher fertility among higher educated.
• Costs for health care increase rapidly with age. Care implications of changing family structures:
personal networks/family versus state? Demise of European health care systems?
• Socio-economic differentials in health & mortality. High age does not entail poor health in case of
higher educated. Rising inequality: concern for policy?
• More complex Family Structures. Family support potential tends to increase next 20-30 years.
Potential for family support lower for cohorts born after 1950.
• Further research required. Best means to maintain supportive networks in old age. Promoting and
maintaining health, balance formal/unpaid care.
It is not easy to say what is actually going on in the future.
Population ageing and decline is a threat to economy and labor force.
Understanding European population dynamics and their precise implications requires:
A careful assessment of the factors shaping current demographic behaviours, e.g. how are
patterns of family formation of young adults shaped by their individual characteristics (e.g.
education, attitudes, migration background) as well as their social networks (e.g. peers,
family) and the wider policy and economic contexts? How many people? And what is their
profile?
While taking into consideration that population dynamics are at the same time strongly
conditioned by past demographic trends (e.g. size and composition of young generations in
terms of educational level, migration background etc.). What is the behavior of people in
their future? Trends.
4