Research methods, revision lecture
Top tips -
Do not confuse designs, methods, sampling
Know your inferential stats test
Write IV correctly, showing both sides
DV must include a form of measurement, e.g. score/level out of
Operationalisation = measurable and specific
Implications for the economy = cash (e.g. tax, childcare)
Assessing reliability (test-retest, inter-rater) and validity (face validity test - more
subjective, concurrent test - correlational coefficient between many of the same
thing), don’t confuse the two.
Science - falsifiability, replicable, objective, general laws
Primary - gained first hand e.g. experiment and secondary data - gained second
hand e.g. metaanalysis, not methods.
Graphs need titles and axis
Histogram - a bar chart that touches
Levels of measurement = gives clues in stimulus. Nominal (mode), Ordinal (median),
Interval (mean).
p<0.05, due to the manipulation of variables 95% of the time.
Two marks are typically to sentences - in research methods
Best way to evaluate - use research
Qualatative ‘please explain, in detail, in your own words’
Quantitative ‘from 1-10’
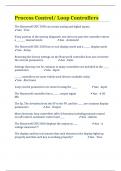
Inferential stats test -
Can, Skat, Man, Whistle, Sounds, Under, Rader, Perception
Test of difference Test of
relationship
Independent Repeated measures/matched Correlation
measures pairs
Nomina Chi Square Sign Test N/A
l
Ordinal Man Whitney Wilcoxon Spearmans Rho
Interval Unrelated T Related T Pearson’s
Nominal - categories
Ordinal - rating scale
Interval - time, temperature, distance
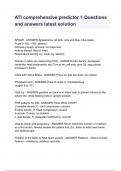
Distribution -
MHPS, MLNS
, Mean higher than median and mode - positively skewed
Mean lower than median and mode - negatively skewed
Distribution - skew (central tendency)
Not to get confused with dispersion - spread/consistency (standard deviation)
Negatively skewed - ceiling effect
Positively skewed - floor effect
Frequency - Y axis
Categories - X axis
Y
X
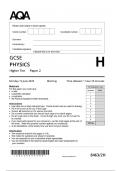
Descriptive stats:
Range - largest data no. – lowest data no.
Standard deviation - incorporates all scores
‘Because a scattergram is suitable for representing correlational data
How to answer a ‘What does the standard deviation show’. Write a conclusion on
what it shows, then use the data above for evidence.
Probability and Significance -
There's a chance anything could happen
Head and tails
Dice
Lottery
In psychology, p in p<0.05 stands for ‘the probability that the results are due to
chance’. For example, the probability that the results are due to chance is less than
or equal to 5% of the time.
We use these to prevent type 1 error (wrongfully accepting the experimental
hypothesis, false positive. Occurs if the P level was too high) and type 2 error
(wrongfully accepting the null, false negative. Occurs if the P level was too low).
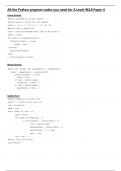
Sign Test -
Void-tied scores that equal 0
Count up the positive and negative signs
Accept the lowest number
Top tips -
Do not confuse designs, methods, sampling
Know your inferential stats test
Write IV correctly, showing both sides
DV must include a form of measurement, e.g. score/level out of
Operationalisation = measurable and specific
Implications for the economy = cash (e.g. tax, childcare)
Assessing reliability (test-retest, inter-rater) and validity (face validity test - more
subjective, concurrent test - correlational coefficient between many of the same
thing), don’t confuse the two.
Science - falsifiability, replicable, objective, general laws
Primary - gained first hand e.g. experiment and secondary data - gained second
hand e.g. metaanalysis, not methods.
Graphs need titles and axis
Histogram - a bar chart that touches
Levels of measurement = gives clues in stimulus. Nominal (mode), Ordinal (median),
Interval (mean).
p<0.05, due to the manipulation of variables 95% of the time.
Two marks are typically to sentences - in research methods
Best way to evaluate - use research
Qualatative ‘please explain, in detail, in your own words’
Quantitative ‘from 1-10’
Inferential stats test -
Can, Skat, Man, Whistle, Sounds, Under, Rader, Perception
Test of difference Test of
relationship
Independent Repeated measures/matched Correlation
measures pairs
Nomina Chi Square Sign Test N/A
l
Ordinal Man Whitney Wilcoxon Spearmans Rho
Interval Unrelated T Related T Pearson’s
Nominal - categories
Ordinal - rating scale
Interval - time, temperature, distance
Distribution -
MHPS, MLNS
, Mean higher than median and mode - positively skewed
Mean lower than median and mode - negatively skewed
Distribution - skew (central tendency)
Not to get confused with dispersion - spread/consistency (standard deviation)
Negatively skewed - ceiling effect
Positively skewed - floor effect
Frequency - Y axis
Categories - X axis
Y
X
Descriptive stats:
Range - largest data no. – lowest data no.
Standard deviation - incorporates all scores
‘Because a scattergram is suitable for representing correlational data
How to answer a ‘What does the standard deviation show’. Write a conclusion on
what it shows, then use the data above for evidence.
Probability and Significance -
There's a chance anything could happen
Head and tails
Dice
Lottery
In psychology, p in p<0.05 stands for ‘the probability that the results are due to
chance’. For example, the probability that the results are due to chance is less than
or equal to 5% of the time.
We use these to prevent type 1 error (wrongfully accepting the experimental
hypothesis, false positive. Occurs if the P level was too high) and type 2 error
(wrongfully accepting the null, false negative. Occurs if the P level was too low).
Sign Test -
Void-tied scores that equal 0
Count up the positive and negative signs
Accept the lowest number