DATA-ANALYSE
I NHOUDSOPGAVE
Topic 1: Correlatie, regressie en tijdreeksen .................................................................................................... 2
1. Correlatie- en regressieanalyse .................................................................................................................. 2
1.1. Correlatieanalyse ............................................................................................................................... 2
2. Regressieanalyse ........................................................................................................................................ 3
Verschillende methodes ................................................................................................................................. 4
3. Determinatiecoëfficiënt .............................................................................................................................. 5
4. Tijdreeksen ................................................................................................................................................. 5
H2: Indexcijfers ............................................................................................................................................... 8
1. Enkelvoudige indexcijfers ........................................................................................................................... 8
1.1. Prijsindexcijfer ................................................................................................................................... 8
1.2. Hoeveelheidsindexcijfer .................................................................................................................... 9
1.3. Waarde-/ omzetcijfer ........................................................................................................................ 9
1.4. Demografisch indexcijfer ................................................................................................................... 9
1.5. Geografische indexcijfers ................................................................................................................ 10
2. Samengestelde indexcijfers ...................................................................................................................... 10
H3: Data & dashboards ................................................................................................................................. 12
1. De Klantenreis .......................................................................................................................................... 12
2. Digital analytics ........................................................................................................................................ 12
3. Een meetplan opstellen ............................................................................................................................ 13
4. Werken met Looker studio ....................................................................................................................... 14
H4: Retail data .............................................................................................................................................. 15
1. Waar data halen?..................................................................................................................................... 15
2. Waarom externe secundaire data? .......................................................................................................... 15
3. Wat willen we weten/ meten? ................................................................................................................. 15
4. Retail <> Consumer panels ....................................................................................................................... 15
4.1. Retail panels .................................................................................................................................... 16
4.2. Consumer panels ............................................................................................................................. 17
5. Retail data ................................................................................................................................................ 17
5.1. Waarom retaili data......................................................................................................................... 17
5.2. NIQ markt indicatoren ..................................................................................................................... 18
5.3. NIQ dimensies.................................................................................................................................. 18
H5: Consumer data – YouGov Belgium .......................................................................................................... 20
1. Consumentenpanel................................................................................................................................... 20
1.1. De parafitt & Collins analyse ........................................................................................................... 21
1.2. Belangrijkste KPI’s............................................................................................................................ 22
1.3. Measure Tree analyse ..................................................................................................................... 22
2. Ad hoc onderzoek ..................................................................................................................................... 23
,H5: YouGov gastcollege ................................................................................................................................ 24
1. YouGov ..................................................................................................................................................... 24
2. Measuring the FMCG Market ................................................................................................................... 24
3. Methodology ............................................................................................................................................ 24
4. From data to insights ............................................................................................................................... 25
5. The Belgian FMCG market ........................................................................................................................ 25
6. Examples & exercises ............................................................................................................................... 26
Verband ó oorzakelijkheid
Verbanden zijn niet noodzakelijk causale (= oorzakelijke) verbanden
Verband betekent niet automatisch dat de ene variabele de oorzaak is van de andere!
T OPIC 1: C ORRELATIE , REGRESSIE EN TIJDREEKSEN
1. CORRELATIE- EN REGRESSIEANALYSE
1.1. CORRELATIEANALYSE
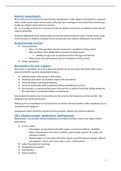
, Negatief lineair Geen verband Positief lineair verband Negatief niet-leniar
verband verband
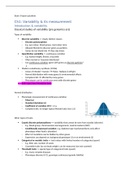
Verband tussen twee variabelen X en Y nagaan
• X onafhankelijke variabele, Y afhankelijke variabele
• Verband of statistische samenhang à Correlatiecoëfficiënt = r
o -1 ≤ r ≤ +1
R = -1 R = +1 R=0
perfect negatief verband perfect positief verband geen verband
Schijnverbanden = verbanden tussen twee variabelen die geen echte oorzaak-gevolgrelatie hebben.
Dit betekent dat de correlatie tussen twee variabelen niet het gevolg is van een direct oorzakelijk
verband, maar door toeval of een verborgen derde variabele.
• Bv: ijsjes verkoop en doden
Perfect negatieve samenhang Perfect positieve samenhang
Negatief verband: als X stijgt dan daalt Y Positief verband: als X stijgt dan stijgt Y
Perfect: punten liggen op 1 lijn Perfect: punten liggen op 1 lijn
àr=-1 à r = +1
Bv: prijs en vraag Bv: prijs en aanbod
• Aard van afhankelijkheid = samenhang
• Graad van afhankelijkheid = punten ligging
Binnen consumentengedrag vind je zelden verbanden die groter zijn dan 0,70 omdat het menselijk
gedrag multigedetermineerd is (dus door verscheidene factoren wordt bepaald).
• |r|= 0,10 à zwak verband
• |r| = 0,20 à matig verband
• |r| = 0,50 à sterk verband
2. REGRESSIEANALYSE
Onderzoekt de invloed van een onafhankelijke variabele (X) op een afhankelijke variabele (Y).
• Lineaire regressie Y = a + bX wordt gebruikt om een trendlijn te berekenen.
I NHOUDSOPGAVE
Topic 1: Correlatie, regressie en tijdreeksen .................................................................................................... 2
1. Correlatie- en regressieanalyse .................................................................................................................. 2
1.1. Correlatieanalyse ............................................................................................................................... 2
2. Regressieanalyse ........................................................................................................................................ 3
Verschillende methodes ................................................................................................................................. 4
3. Determinatiecoëfficiënt .............................................................................................................................. 5
4. Tijdreeksen ................................................................................................................................................. 5
H2: Indexcijfers ............................................................................................................................................... 8
1. Enkelvoudige indexcijfers ........................................................................................................................... 8
1.1. Prijsindexcijfer ................................................................................................................................... 8
1.2. Hoeveelheidsindexcijfer .................................................................................................................... 9
1.3. Waarde-/ omzetcijfer ........................................................................................................................ 9
1.4. Demografisch indexcijfer ................................................................................................................... 9
1.5. Geografische indexcijfers ................................................................................................................ 10
2. Samengestelde indexcijfers ...................................................................................................................... 10
H3: Data & dashboards ................................................................................................................................. 12
1. De Klantenreis .......................................................................................................................................... 12
2. Digital analytics ........................................................................................................................................ 12
3. Een meetplan opstellen ............................................................................................................................ 13
4. Werken met Looker studio ....................................................................................................................... 14
H4: Retail data .............................................................................................................................................. 15
1. Waar data halen?..................................................................................................................................... 15
2. Waarom externe secundaire data? .......................................................................................................... 15
3. Wat willen we weten/ meten? ................................................................................................................. 15
4. Retail <> Consumer panels ....................................................................................................................... 15
4.1. Retail panels .................................................................................................................................... 16
4.2. Consumer panels ............................................................................................................................. 17
5. Retail data ................................................................................................................................................ 17
5.1. Waarom retaili data......................................................................................................................... 17
5.2. NIQ markt indicatoren ..................................................................................................................... 18
5.3. NIQ dimensies.................................................................................................................................. 18
H5: Consumer data – YouGov Belgium .......................................................................................................... 20
1. Consumentenpanel................................................................................................................................... 20
1.1. De parafitt & Collins analyse ........................................................................................................... 21
1.2. Belangrijkste KPI’s............................................................................................................................ 22
1.3. Measure Tree analyse ..................................................................................................................... 22
2. Ad hoc onderzoek ..................................................................................................................................... 23
,H5: YouGov gastcollege ................................................................................................................................ 24
1. YouGov ..................................................................................................................................................... 24
2. Measuring the FMCG Market ................................................................................................................... 24
3. Methodology ............................................................................................................................................ 24
4. From data to insights ............................................................................................................................... 25
5. The Belgian FMCG market ........................................................................................................................ 25
6. Examples & exercises ............................................................................................................................... 26
Verband ó oorzakelijkheid
Verbanden zijn niet noodzakelijk causale (= oorzakelijke) verbanden
Verband betekent niet automatisch dat de ene variabele de oorzaak is van de andere!
T OPIC 1: C ORRELATIE , REGRESSIE EN TIJDREEKSEN
1. CORRELATIE- EN REGRESSIEANALYSE
1.1. CORRELATIEANALYSE
, Negatief lineair Geen verband Positief lineair verband Negatief niet-leniar
verband verband
Verband tussen twee variabelen X en Y nagaan
• X onafhankelijke variabele, Y afhankelijke variabele
• Verband of statistische samenhang à Correlatiecoëfficiënt = r
o -1 ≤ r ≤ +1
R = -1 R = +1 R=0
perfect negatief verband perfect positief verband geen verband
Schijnverbanden = verbanden tussen twee variabelen die geen echte oorzaak-gevolgrelatie hebben.
Dit betekent dat de correlatie tussen twee variabelen niet het gevolg is van een direct oorzakelijk
verband, maar door toeval of een verborgen derde variabele.
• Bv: ijsjes verkoop en doden
Perfect negatieve samenhang Perfect positieve samenhang
Negatief verband: als X stijgt dan daalt Y Positief verband: als X stijgt dan stijgt Y
Perfect: punten liggen op 1 lijn Perfect: punten liggen op 1 lijn
àr=-1 à r = +1
Bv: prijs en vraag Bv: prijs en aanbod
• Aard van afhankelijkheid = samenhang
• Graad van afhankelijkheid = punten ligging
Binnen consumentengedrag vind je zelden verbanden die groter zijn dan 0,70 omdat het menselijk
gedrag multigedetermineerd is (dus door verscheidene factoren wordt bepaald).
• |r|= 0,10 à zwak verband
• |r| = 0,20 à matig verband
• |r| = 0,50 à sterk verband
2. REGRESSIEANALYSE
Onderzoekt de invloed van een onafhankelijke variabele (X) op een afhankelijke variabele (Y).
• Lineaire regressie Y = a + bX wordt gebruikt om een trendlijn te berekenen.