Prepared by Yusra Mahmood
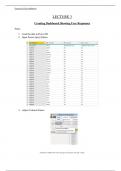
LECTURE 3
Creating Dashboard Showing User Responses
Steps:
1. Load the data in Power BI.
2. Open Power Query Editor.
3. Adjust Column Names.
“It doesn’t matter how slow you go as long as you don’t stop.”
LECTURE 3
Creating Dashboard Showing User Responses
Steps:
1. Load the data in Power BI.
2. Open Power Query Editor.
3. Adjust Column Names.
“It doesn’t matter how slow you go as long as you don’t stop.”