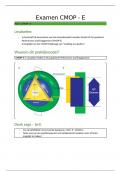
Variabelen maken:
- Value: toevoegen bij categorieën
- Missing: discrete bij zelf invullen en range als al is ingevuld
- Measure: kwantitatief is scale
Select cases: Data → select cases → if condition… → if
- If: typ de conditie bij een variabele
- Daarna worden de berekeningen met de geselecteerde subset uitgevoerd.
Sort Cases: Data → sort cases
- Kies een variabele
- Kies per variabele ascending of descending.
Split files: Data → split file → organize by groups
- Als: berekeningen maken los voor verschillende groepen
- Kies de variabele die je wil splitten.
- Bij outputs komen er 2 losse outputs voor de groepen.
Frequenties: Analyze → descriptive statistics → frequencies
- In statistics klik je aan wat je wil hebben
- Frequency table voor tabel → frequency, % (alle cases), valid % (zonder missing) en
cum. %
- Charts voor diagrammen
Descriptive statistics: Analyse → descriptive statistics → descriptives
- Options: kies welke statistieken je wil hebben
- Lijkt op frequencies, maar is kleiner.
Z-scores: Analyze → descriptive statistics → descriptives
- Vink save standardized values aan.
- Een variabele met z-scores komt helemaal rechts te staan.
Crosstabs: Analyze → descriptive statistics → crosstabs
- Laat relatie zien tussen categorische variabelen
- Kies variabelen voor de rijen en kolommen, maakt niet uit welke volgorde
- Kies cells, zet observed en percentages aan.
Explore function: Analyze → descriptive statistics → explore
- Geeft meer mogelijkheden in output.
- Dependent: hier komen de resultaten weer uit
- Factor: groepeert de resultaten
- Statistics: klik welke statistieken je wil hebben
- Plots: kies een diagram.
Summaries: Analyze → reports → case summaries
- Als: verschillende groepen waarvan je descriptives wil vergelijken waarbij waarden
gesplitst worden
- Variables: wat je wil berekenen - kwantitatief
- Grouping variables: de groepen - categorisch
- Statistics: kies welke statistieken je wil hebben.
- Display cases: laat case nummers zien en limiteert