UNIT I : INTRODUCTION TO BIG DATA, FRAMEWORKS AND VISUALIZATION 10
1. Big Data and Data Science
2. Big Data Analytics, Business intelligence vs Big data,
3. Big data frameworks -Hadoop, Hive, MapR, Sharding
4. MapReduce
5. NoSQL Databases ,S3
6. Hadoop Distributed file systems,
7. Current landscape of analytics,
8. Data visualization techniques, visualization software.
Big Data and Data Science
What is big data?
Data which are very large in size is called Big Data. Normally we work on data of size
MB(WordDoc ,Excel) or maximum GB(Movies, Codes) but data in Peta bytes i.e. 10 15 byte size is called
Big Data. It is stated that almost 90% of today's data has been generated in the past 3 years.
Sources of Big Data
These data come from many sources like
o Social networking sites: Facebook, Google, LinkedIn all these sites generates huge amount of data
on a day to day basis as they have billions of users worldwide.
o E-commerce site: Sites like Amazon, Flipkart, Alibaba generates huge amount of logs from which
users buying trends can be traced.
o Weather Station: All the weather station and satellite gives very huge data which are stored and
manipulated to forecast weather.
o Telecom company: Telecom giants like Airtel, Vodafone study the user trends and accordingly
publish their plans and for this they store the data of its million users.
o Share Market: Stock exchange across the world generates huge amount of data through its daily
transaction.
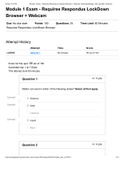
3V's of Big Data
1. Velocity: The data is increasing at a very fast rate. It is estimated that the volume of data will
double in every 2 years.
2. Variety: Now a days data are not stored in rows and column. Data is structured as well as
unstructured. Log file, CCTV footage is unstructured data. Data which can be saved in tables are
structured data like the transaction data of the bank.
3. Volume: The amount of data which we deal with is of very large size of Peta bytes.
,Types of big data
1. Structured data. Any data set that adheres to a specific structure can be called structured data.
These structured data sets can be processed relatively easily compared to other data types as users
can exactly identify the structure of the data. A good example for structured data will be a
distributed RDBMS which contains data in organized table structures.
2. Semi-structured data. This type of data does not adhere to a specific structure yet retains some
kind of observable structure such as a grouping or an organized hierarchy. Some examples of semi-
structured data will be markup languages (XML), web pages, emails, etc.
3. Unstructured data. This type of data consists of data that does not adhere to a schema or a preset
structure. It is the most common type of data when dealing with big data—things like text, pictures,
video, and audio all come up under this type.
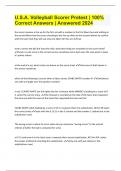
What is data science?
o Data science is the art and science of acquiring knowledge through data.
o Data science is a multidisciplinary approach that extracts information from data by
combining:
Scientific methods
Maths and statistics
Programming
Advanced analytics
ML and AI
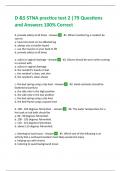
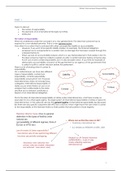
,Data Analytics Lifecycle:
The Data analytic lifecycle is designed for Big Data problems and data science projects. The cycle is
iterative to represent real project. To address the distinct requirements for performing analysis on Big
Data, step – by – step methodology is needed to organize the activities and tasks involved with
acquiring, processing, analyzing, and repurposing data.
Phase 1: Discovery:
The data science team learns and investigates the problem.
Develop context and understanding.
Come to know about data sources needed and available for the project.
The team formulates initial hypothesis that can be later tested with data.
Phase 2: Data Preparation
Steps to explore, preprocess, and condition data prior to modeling and analysis.
It requires the presence of an analytic sandbox, the team execute, load, and transform, to get data into
the sandbox.
Data preparation tasks are likely to be performed multiple times and not in predefined order.
Several tools commonly used for this phase are – Hadoop, Alpine Miner, Open Refine, etc.
Phase 3: Model Planning
Team explores data to learn about relationships between variables and subsequently, selects key
variables and the most suitable models.
In this phase, data science team develop data sets for training, testing, and production purposes.
Team builds and executes models based on the work done in the model planning phase.
Several tools commonly used for this phase are – Matlab, STASTICA.
Phase 4: Model Building
Team develops datasets for testing, training, and production purposes.
Team also considers whether its existing tools will suffice for running the models or if they need more
robust environment for executing models.
Free or open-source tools – Rand PL/R, Octave, WEKA.
Commercial tools – Matlab , STASTICA.
Phase 5: Communication Results
After executing model team need to compare outcomes of modeling to criteria established for success
and failure.
, Team considers how best to articulate findings and outcomes to various team members and
stakeholders, taking into account warning, assumptions.
Team should identify key findings, quantify business value, and develop narrative to summarize and
convey findings to stakeholders.
Phase 6: Operationalize
The team communicates benefits of project more broadly and sets up pilot project to deploy work in
controlled way before broadening the work to full enterprise of users.
This approach enables team to learn about performance and related constraints of the model in
production environment on small scale, and make adjustments before full deployment.
The team delivers final reports, briefings, codes.
Free or open source tools – Octave, WEKA, SQL, MADlib.
1. Big Data and Data Science
2. Big Data Analytics, Business intelligence vs Big data,
3. Big data frameworks -Hadoop, Hive, MapR, Sharding
4. MapReduce
5. NoSQL Databases ,S3
6. Hadoop Distributed file systems,
7. Current landscape of analytics,
8. Data visualization techniques, visualization software.
Big Data and Data Science
What is big data?
Data which are very large in size is called Big Data. Normally we work on data of size
MB(WordDoc ,Excel) or maximum GB(Movies, Codes) but data in Peta bytes i.e. 10 15 byte size is called
Big Data. It is stated that almost 90% of today's data has been generated in the past 3 years.
Sources of Big Data
These data come from many sources like
o Social networking sites: Facebook, Google, LinkedIn all these sites generates huge amount of data
on a day to day basis as they have billions of users worldwide.
o E-commerce site: Sites like Amazon, Flipkart, Alibaba generates huge amount of logs from which
users buying trends can be traced.
o Weather Station: All the weather station and satellite gives very huge data which are stored and
manipulated to forecast weather.
o Telecom company: Telecom giants like Airtel, Vodafone study the user trends and accordingly
publish their plans and for this they store the data of its million users.
o Share Market: Stock exchange across the world generates huge amount of data through its daily
transaction.
3V's of Big Data
1. Velocity: The data is increasing at a very fast rate. It is estimated that the volume of data will
double in every 2 years.
2. Variety: Now a days data are not stored in rows and column. Data is structured as well as
unstructured. Log file, CCTV footage is unstructured data. Data which can be saved in tables are
structured data like the transaction data of the bank.
3. Volume: The amount of data which we deal with is of very large size of Peta bytes.
,Types of big data
1. Structured data. Any data set that adheres to a specific structure can be called structured data.
These structured data sets can be processed relatively easily compared to other data types as users
can exactly identify the structure of the data. A good example for structured data will be a
distributed RDBMS which contains data in organized table structures.
2. Semi-structured data. This type of data does not adhere to a specific structure yet retains some
kind of observable structure such as a grouping or an organized hierarchy. Some examples of semi-
structured data will be markup languages (XML), web pages, emails, etc.
3. Unstructured data. This type of data consists of data that does not adhere to a schema or a preset
structure. It is the most common type of data when dealing with big data—things like text, pictures,
video, and audio all come up under this type.
What is data science?
o Data science is the art and science of acquiring knowledge through data.
o Data science is a multidisciplinary approach that extracts information from data by
combining:
Scientific methods
Maths and statistics
Programming
Advanced analytics
ML and AI
,Data Analytics Lifecycle:
The Data analytic lifecycle is designed for Big Data problems and data science projects. The cycle is
iterative to represent real project. To address the distinct requirements for performing analysis on Big
Data, step – by – step methodology is needed to organize the activities and tasks involved with
acquiring, processing, analyzing, and repurposing data.
Phase 1: Discovery:
The data science team learns and investigates the problem.
Develop context and understanding.
Come to know about data sources needed and available for the project.
The team formulates initial hypothesis that can be later tested with data.
Phase 2: Data Preparation
Steps to explore, preprocess, and condition data prior to modeling and analysis.
It requires the presence of an analytic sandbox, the team execute, load, and transform, to get data into
the sandbox.
Data preparation tasks are likely to be performed multiple times and not in predefined order.
Several tools commonly used for this phase are – Hadoop, Alpine Miner, Open Refine, etc.
Phase 3: Model Planning
Team explores data to learn about relationships between variables and subsequently, selects key
variables and the most suitable models.
In this phase, data science team develop data sets for training, testing, and production purposes.
Team builds and executes models based on the work done in the model planning phase.
Several tools commonly used for this phase are – Matlab, STASTICA.
Phase 4: Model Building
Team develops datasets for testing, training, and production purposes.
Team also considers whether its existing tools will suffice for running the models or if they need more
robust environment for executing models.
Free or open-source tools – Rand PL/R, Octave, WEKA.
Commercial tools – Matlab , STASTICA.
Phase 5: Communication Results
After executing model team need to compare outcomes of modeling to criteria established for success
and failure.
, Team considers how best to articulate findings and outcomes to various team members and
stakeholders, taking into account warning, assumptions.
Team should identify key findings, quantify business value, and develop narrative to summarize and
convey findings to stakeholders.
Phase 6: Operationalize
The team communicates benefits of project more broadly and sets up pilot project to deploy work in
controlled way before broadening the work to full enterprise of users.
This approach enables team to learn about performance and related constraints of the model in
production environment on small scale, and make adjustments before full deployment.
The team delivers final reports, briefings, codes.
Free or open source tools – Octave, WEKA, SQL, MADlib.