Test Bank
Introduction To The Practice Of Statistics
By David S. Moore
10th Edition
,Introduction To The Practice Of Statistics By David S. Moore 10th Edition
1. Fill In The Blank. When Creating A Scatterplot, One Should Use The
Axi
s For The Explanatory Variable If A Regression Line Is To Be Fit To The Data.
2. Fill In The Blank. A Study Is Conducted To Determine If One Can Predict The Yield
Of A Crop Based On The Amount Of Yearly Rainfall. The Variable Is The
Response Variable In This Study.
3. Fill In The Blank. A Researcher Is Interested In Determining If One Could Predict The
Score On A Statistics Exam From The Amount Of Time Spent Studying For The Exam.
The Variable
Is The Explanatory Variable In This Study.
4. Fill In The Blank. The Environmental Protection Agency Records Data On The Fuel
Economy Of Many Different Makes Of Cars. They Are Interested In Determining If
One Could Predict The Mileage Of The Car (In Miles Per Gallon) From The Weight
Of The Car (In Lbs.). The Variable Is The Response Variable In This Study.
5. Fill In The Blank. The Owner Of A Winery Collects Data On Competing Wineries
Every Year. He Would Like To Predict The Gross Sales (In Number Of Cases) From
The Size Of The Wineries (In Acres). The Variable Is The Explanatory Variable In
This Study.
6. Fill In The Blank. A Scatterplot Is A Graphical Tool For Displaying The Relationship
Between Two Variables Measured On The Same Individuals.
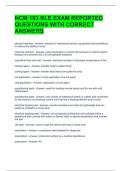
,7. A Researcher Measured The Height (In Feet) And Volume Of Usable Lumber (In
Cubic Feet) Of 32 Cherry Trees. The Goal Is To Determine If The Volume Of
Usable Lumber Can Be Estimated From The Height Of A Tree. The Results Are
Plotted Below:
Fill In The Blank. The Variable Is The Response Variable In This Study.
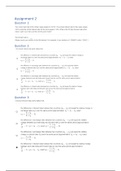
, 8. A Researcher Measured The Height (In Feet) And Volume Of Usable Lumber (In
Cubic Feet) Of 32 Cherry Trees. The Goal Is To Determine If The Volume Of
Usable Lumber Can Be Estimated From The Height Of A Tree. The Results Are
Plotted Below:
Select All Descriptions That Apply To The Scatterplot.
A) There Is A Positive Association Between Height And Volume.
B) There Is A Negative Association Between Height And Volume.
C) There Is An Outlier In The Plot.
D) The Plot Is Skewed To The Left.
E) Both A And C
Introduction To The Practice Of Statistics
By David S. Moore
10th Edition
,Introduction To The Practice Of Statistics By David S. Moore 10th Edition
1. Fill In The Blank. When Creating A Scatterplot, One Should Use The
Axi
s For The Explanatory Variable If A Regression Line Is To Be Fit To The Data.
2. Fill In The Blank. A Study Is Conducted To Determine If One Can Predict The Yield
Of A Crop Based On The Amount Of Yearly Rainfall. The Variable Is The
Response Variable In This Study.
3. Fill In The Blank. A Researcher Is Interested In Determining If One Could Predict The
Score On A Statistics Exam From The Amount Of Time Spent Studying For The Exam.
The Variable
Is The Explanatory Variable In This Study.
4. Fill In The Blank. The Environmental Protection Agency Records Data On The Fuel
Economy Of Many Different Makes Of Cars. They Are Interested In Determining If
One Could Predict The Mileage Of The Car (In Miles Per Gallon) From The Weight
Of The Car (In Lbs.). The Variable Is The Response Variable In This Study.
5. Fill In The Blank. The Owner Of A Winery Collects Data On Competing Wineries
Every Year. He Would Like To Predict The Gross Sales (In Number Of Cases) From
The Size Of The Wineries (In Acres). The Variable Is The Explanatory Variable In
This Study.
6. Fill In The Blank. A Scatterplot Is A Graphical Tool For Displaying The Relationship
Between Two Variables Measured On The Same Individuals.
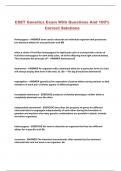
,7. A Researcher Measured The Height (In Feet) And Volume Of Usable Lumber (In
Cubic Feet) Of 32 Cherry Trees. The Goal Is To Determine If The Volume Of
Usable Lumber Can Be Estimated From The Height Of A Tree. The Results Are
Plotted Below:
Fill In The Blank. The Variable Is The Response Variable In This Study.
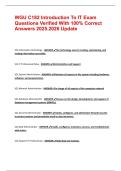
, 8. A Researcher Measured The Height (In Feet) And Volume Of Usable Lumber (In
Cubic Feet) Of 32 Cherry Trees. The Goal Is To Determine If The Volume Of
Usable Lumber Can Be Estimated From The Height Of A Tree. The Results Are
Plotted Below:
Select All Descriptions That Apply To The Scatterplot.
A) There Is A Positive Association Between Height And Volume.
B) There Is A Negative Association Between Height And Volume.
C) There Is An Outlier In The Plot.
D) The Plot Is Skewed To The Left.
E) Both A And C