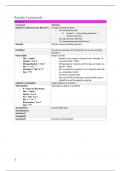
Rstudio Commands
General
Command Meaning
Setwd(“C:/wherever your files are”) Change working directory
- Can be done like this:
o ‘session’ -> ‘set working directory’ ->
‘choose directory’
- Can also be done like this:
("C:/temp/whereverYourFilesAre")
Getwd() Get the current working directory
List.files() You get an overview of the files that are in your working
directory
Read.table() Read in a table
- File = “name” - Header: every column needs to have a header
- Header = T or F manually fixed = TRUE
- Stringsasfactors = T or F - Stringsasfactor: columns with strings are read in as
- Dec = “,” or “.” factors = TRUE
- Na.string = “NA” or “?” - Dec: R needs to recognize it as a character and not
- Sep = “\t” as a calculation factor
- Na.string: missing value
- Sep: to tell R that only tabs (and not white space)
should be used to seperate columns
myData<-read.table() Assign table to an R-object
Write.table() Exporting an object to a pdf file
- X = name of data frame -
- File = “name”
- Quote = T or F
- Na = “NA” or “?”
- Dec = “,” or “.”
- Row.names = T or F
- Sep = “\t”
As.numeric() Convert data type
As.character()
As.factor ()
As.logical()
Summary() Summary of the dataset
1
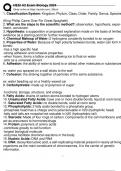
, Practical 1
COMMAND MEANING
Class(myData) What kind of data structure
Str(myData) A more comprehensive overview of data
structure
Names(myData) Gives the headers
Dim(myData) Dimensions of a table
Nrow(myData) Number of rows and columns
Ncol(myData)
Length(myData$exam) Points of exam that are represented in a vector
gives length of the vector
1:3 Vector of the numbers one to three
seq(from=1, to=3, by = 1)
c(1,2,3)
Levels(myData$gender) Levels of the factor
- Factor is a data structure for categorical
variables
myData$workshop <- Assign more descriptive names tot he factor
factor(myData$workshop, levels
levels = c(1,2,3) , labels =
c("R","SAS","SPSS") )
c(“John”,”Paul”,”George”, To make a character vector yourself
”Ringo”)
Ifelse() Make a new binary variable
- F.e. if a person passed the exam
[…] To select a part of a data structure
- [ ,j] - Columns
- [i, ] - Rows
Names()[3]<-“sex” Change the variable names
- [3]: row name you want to change
- <-“sex”: change to sex
Demo.matrix<- Construct a matrix
matrix(1:12,nrow=3,byrow - This is a 2 dimensional table
=T) - 1:12: because 12 observations
- Nrow:
- Byrow: added since by default, a matrix
is filled up by columns
Demo.matrix[3,1] If you want element on 3th row and 1st column
[,1:2] No index for the rows, which meas all rows are
selected only a selection in the columns
Order() Order dataset according to …
O<-order(myData$exam) Sort entire data frame according to exam
+myData[o,] results ASCENDING
O<-order(-myData$exam) Sort entire data frame according to exam
+myData[o,] results DESCENDING
== Condition that the row/column need to fulfill in
order tob e selected
myX or myY Vecotr with X- or Y-values
Plot() Generate a plot
- Pch - Pch: argument to change a plot
- Itl character
- Col - Itl: argument to change the type of line
- Col: argument to change the colors
2
General
Command Meaning
Setwd(“C:/wherever your files are”) Change working directory
- Can be done like this:
o ‘session’ -> ‘set working directory’ ->
‘choose directory’
- Can also be done like this:
("C:/temp/whereverYourFilesAre")
Getwd() Get the current working directory
List.files() You get an overview of the files that are in your working
directory
Read.table() Read in a table
- File = “name” - Header: every column needs to have a header
- Header = T or F manually fixed = TRUE
- Stringsasfactors = T or F - Stringsasfactor: columns with strings are read in as
- Dec = “,” or “.” factors = TRUE
- Na.string = “NA” or “?” - Dec: R needs to recognize it as a character and not
- Sep = “\t” as a calculation factor
- Na.string: missing value
- Sep: to tell R that only tabs (and not white space)
should be used to seperate columns
myData<-read.table() Assign table to an R-object
Write.table() Exporting an object to a pdf file
- X = name of data frame -
- File = “name”
- Quote = T or F
- Na = “NA” or “?”
- Dec = “,” or “.”
- Row.names = T or F
- Sep = “\t”
As.numeric() Convert data type
As.character()
As.factor ()
As.logical()
Summary() Summary of the dataset
1
, Practical 1
COMMAND MEANING
Class(myData) What kind of data structure
Str(myData) A more comprehensive overview of data
structure
Names(myData) Gives the headers
Dim(myData) Dimensions of a table
Nrow(myData) Number of rows and columns
Ncol(myData)
Length(myData$exam) Points of exam that are represented in a vector
gives length of the vector
1:3 Vector of the numbers one to three
seq(from=1, to=3, by = 1)
c(1,2,3)
Levels(myData$gender) Levels of the factor
- Factor is a data structure for categorical
variables
myData$workshop <- Assign more descriptive names tot he factor
factor(myData$workshop, levels
levels = c(1,2,3) , labels =
c("R","SAS","SPSS") )
c(“John”,”Paul”,”George”, To make a character vector yourself
”Ringo”)
Ifelse() Make a new binary variable
- F.e. if a person passed the exam
[…] To select a part of a data structure
- [ ,j] - Columns
- [i, ] - Rows
Names()[3]<-“sex” Change the variable names
- [3]: row name you want to change
- <-“sex”: change to sex
Demo.matrix<- Construct a matrix
matrix(1:12,nrow=3,byrow - This is a 2 dimensional table
=T) - 1:12: because 12 observations
- Nrow:
- Byrow: added since by default, a matrix
is filled up by columns
Demo.matrix[3,1] If you want element on 3th row and 1st column
[,1:2] No index for the rows, which meas all rows are
selected only a selection in the columns
Order() Order dataset according to …
O<-order(myData$exam) Sort entire data frame according to exam
+myData[o,] results ASCENDING
O<-order(-myData$exam) Sort entire data frame according to exam
+myData[o,] results DESCENDING
== Condition that the row/column need to fulfill in
order tob e selected
myX or myY Vecotr with X- or Y-values
Plot() Generate a plot
- Pch - Pch: argument to change a plot
- Itl character
- Col - Itl: argument to change the type of line
- Col: argument to change the colors
2