BUAL 2650 Chen Yan Exam |58 Q’s and
A’s (Final Exam)
Business Analyst - -Person who manages, cleans, and aggregates data;
serves as a bridge between stakeholders and business by conducting
analytical studies to help change business processes
- Business User - -person who takes data to make decisions based on their
jobs and also interprets data
- Data Scientist - -a person skilled in data inference, algorithm development
and technology in order to solve complex problems.
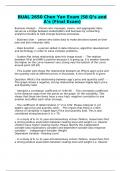
- Scatter Plot (what relationship does this image show) - -The relation
between %Fat and BMI is positive because it is going up. It is weaker towards
the higher on the curve however very strong near the bottom of the curve
around point (20,20)
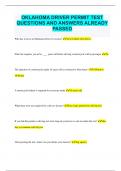
- This scatter plot shows the relationship between an iPhone app's price and
the quantity sold at different prices in thousands. A line of best fit is given.
Question: What's the relationship between app's price and quantity sold? - -
This graph shows a negative, strong relationship between Apple App's price
and Quantity Sold.
- Interpret a correlation coefficient of -0.96 (R) - -The correlation coefficient
is the distance away from the points on the graph. Or the variability. This
shows that these two items have a very high, negative correlation to one
another and affect each other strongly.
- The coefficient of determination (r^2) is 0.92. Please interpret it. (of
apple's app price and quantity sold) - -This means that there is a 92%
chance of variability in Apple App's Price and Quantity Sold. This is also
considered strong because it is >.70.
- In a study of 6- to 11-year-old elementary school children, researchers find
a strong positive association between reading level and weight (i.e. Heavier
children have higher reading levels). Please identify the independent
variable (aka explanatory variable) and dependent variable (aka response
variable). - -Independant Variable- Weight
Dependant Variable - Reading Level
- In a study of 6- to 11-year-old elementary school children, researchers find
a strong positive association between reading level and weight (i.e. Heavier
, children have higher reading levels). Please identify a potential lurking
variable and explain why. - -Heavier children eat more meaning they have
more money, which means they have a better education. Or the heavier kids
have more free time than not as heavy kids, due to physical activity, causing
them to have more practice time reading.
- Time Series (Components) - -trend, cyclical, seasonal, irregular
- Trend - -long run growth, or decline
- Cycle - -long-run up and down fluctuation around the trend level
- Seasonal - -Regular periodic up and down movements that repeat within
the calendar year
- Irregular - -Erratic very short-run movements that follow no regular
pattern
- Trend - --sales decreasing and increasing over time
-sales is the dependent variable
-time is the independent variable
-can use quadratic regression
- Analytics - -a process that examines data using a variety of statistical
tools and involves the discovery, interpretation, and application of
meaningful patterns toward effective decisions making in the workplace
- Statistics - -branch of mathematics that studies methods for the
calculation of probabilities and provides tools for prediction and forecasting
models
- Seven steps of business analytic process - -1. Define the business problem
2. Manage Data
3. Descriptive Analytics
4. Predictive Analytics
5. Prescriptive Analytics
6. Make actionable recommendations
7. Ask the next questions
- Simple linear regression is how many variables?
What do we use for simple linear in terms of r square, how about multiple
linear? - -a. 1
b. For simple linear regression we use regular r square, and for multiple, we
use adjusted r square, the adjusted value will help us adjust our variables
and their values.
A’s (Final Exam)
Business Analyst - -Person who manages, cleans, and aggregates data;
serves as a bridge between stakeholders and business by conducting
analytical studies to help change business processes
- Business User - -person who takes data to make decisions based on their
jobs and also interprets data
- Data Scientist - -a person skilled in data inference, algorithm development
and technology in order to solve complex problems.
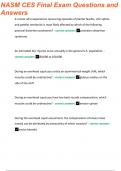
- Scatter Plot (what relationship does this image show) - -The relation
between %Fat and BMI is positive because it is going up. It is weaker towards
the higher on the curve however very strong near the bottom of the curve
around point (20,20)
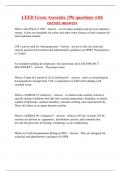
- This scatter plot shows the relationship between an iPhone app's price and
the quantity sold at different prices in thousands. A line of best fit is given.
Question: What's the relationship between app's price and quantity sold? - -
This graph shows a negative, strong relationship between Apple App's price
and Quantity Sold.
- Interpret a correlation coefficient of -0.96 (R) - -The correlation coefficient
is the distance away from the points on the graph. Or the variability. This
shows that these two items have a very high, negative correlation to one
another and affect each other strongly.
- The coefficient of determination (r^2) is 0.92. Please interpret it. (of
apple's app price and quantity sold) - -This means that there is a 92%
chance of variability in Apple App's Price and Quantity Sold. This is also
considered strong because it is >.70.
- In a study of 6- to 11-year-old elementary school children, researchers find
a strong positive association between reading level and weight (i.e. Heavier
children have higher reading levels). Please identify the independent
variable (aka explanatory variable) and dependent variable (aka response
variable). - -Independant Variable- Weight
Dependant Variable - Reading Level
- In a study of 6- to 11-year-old elementary school children, researchers find
a strong positive association between reading level and weight (i.e. Heavier
, children have higher reading levels). Please identify a potential lurking
variable and explain why. - -Heavier children eat more meaning they have
more money, which means they have a better education. Or the heavier kids
have more free time than not as heavy kids, due to physical activity, causing
them to have more practice time reading.
- Time Series (Components) - -trend, cyclical, seasonal, irregular
- Trend - -long run growth, or decline
- Cycle - -long-run up and down fluctuation around the trend level
- Seasonal - -Regular periodic up and down movements that repeat within
the calendar year
- Irregular - -Erratic very short-run movements that follow no regular
pattern
- Trend - --sales decreasing and increasing over time
-sales is the dependent variable
-time is the independent variable
-can use quadratic regression
- Analytics - -a process that examines data using a variety of statistical
tools and involves the discovery, interpretation, and application of
meaningful patterns toward effective decisions making in the workplace
- Statistics - -branch of mathematics that studies methods for the
calculation of probabilities and provides tools for prediction and forecasting
models
- Seven steps of business analytic process - -1. Define the business problem
2. Manage Data
3. Descriptive Analytics
4. Predictive Analytics
5. Prescriptive Analytics
6. Make actionable recommendations
7. Ask the next questions
- Simple linear regression is how many variables?
What do we use for simple linear in terms of r square, how about multiple
linear? - -a. 1
b. For simple linear regression we use regular r square, and for multiple, we
use adjusted r square, the adjusted value will help us adjust our variables
and their values.