CED 201
Introductory Environmental and Resource Economics
Assignment 2
Assigned: 02/21/2025
Due: 03/07/2025
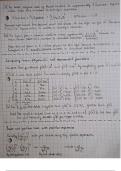
1. Value of Statistical Life. (20 points) Derive an estimate of VSL using the application based
on seatbelt usage and the chance of death in a car accident below.
Problem Setup
• The annual chance of death in a car accident in PA is:
Risk𝟏𝟎𝟎𝟒𝟖
𝟏
= 𝟎. 𝟎𝟎𝟎𝟎𝟗𝟗 𝐨𝐫 𝟎. 𝟎𝟎𝟗𝟗%
Added
Usetheseto
• If you do not wear your seatbelt you increase your chance of death by 60%.
galfish • The average person takes 1,850 round-trip car trips per year. don'tNEEDthis
• The median hourly wage is $28. WTP
premium
WTP • Forroundtrip 20sec
The average time to buckle and unbuckle a seatbelt on a one-way trip is 10 seconds.
a. (10 points) Use the information in the setup above to derive an estimate for the Value of
Statistical Life.
b. (10 points) Does your result make sense? What things may be missing from the
problem?
, 2. Willingness to Pay for Water Quality (40 points) Spring Creek is a 25-mile-long stream fully
contained within Centre County. It is used extensively for various outdoor recreation
activities; it also likely has a significant non-use value to county residents. The stream,
however, continues to face increased environmental pressures as land-use activities within its
watershed impact its water quality. As a result, the county is proposing the preservation of
600 acres of land in and around the stream’s boundaries to help reduce the external impact
of this activity. While the specific sites have yet to be chosen, the expected average cost per
acre is $15,000.
To pay for these land acquisitions, the county is planning a ballot initiative proposing a one-
year increase in per-household water bills to cover the cost of the land acquisition. Before
they proceed, however, they want to know if there is an appetite for the policy. Thus, they
contracted with the CED 201 class at Penn State to run a stated preference (contingent
valuation) (SP) survey to help answer the question.
The SP survey was sent out to random sample of county households and was returned by
458 of them. Each household was given a description along with an image (see below) of the
proposed policy along with its pros and cons.
Then, they were asked the following question:
If the Centre County land acquisition plan for Spring Creek was on the ballot in the next election and it cost
your household $___ each quarter over the next year (4 payments of this amount) in higher water bills,
would you vote in favor or against?
____I would vote YES ____I would vote NO
The dollar amounts are one of the following 12 values: ($2,3,5,10,15,17,20,35,50,70,90,170).
a. (20 points) The data returned from the survey in contained the Excel spreadsheet called
Q3_wtp_data.xlsx. The data has three columns: (1) Choice, which is a yes (1) or no (0)
response to the question asked in the survey; (2) the Bid amount
($2,3,5,10,15,17,20,35,50,70,90,170) offered to each household; and (3) the household’s
income. For this question, I want you to use the Choice and Bid variables and plot a
WTP curve based on the household responses. This will be a figure with Bid amounts on
one axis and response rates on another. Does the figure make sense?
Introductory Environmental and Resource Economics
Assignment 2
Assigned: 02/21/2025
Due: 03/07/2025
1. Value of Statistical Life. (20 points) Derive an estimate of VSL using the application based
on seatbelt usage and the chance of death in a car accident below.
Problem Setup
• The annual chance of death in a car accident in PA is:
Risk𝟏𝟎𝟎𝟒𝟖
𝟏
= 𝟎. 𝟎𝟎𝟎𝟎𝟗𝟗 𝐨𝐫 𝟎. 𝟎𝟎𝟗𝟗%
Added
Usetheseto
• If you do not wear your seatbelt you increase your chance of death by 60%.
galfish • The average person takes 1,850 round-trip car trips per year. don'tNEEDthis
• The median hourly wage is $28. WTP
premium
WTP • Forroundtrip 20sec
The average time to buckle and unbuckle a seatbelt on a one-way trip is 10 seconds.
a. (10 points) Use the information in the setup above to derive an estimate for the Value of
Statistical Life.
b. (10 points) Does your result make sense? What things may be missing from the
problem?
, 2. Willingness to Pay for Water Quality (40 points) Spring Creek is a 25-mile-long stream fully
contained within Centre County. It is used extensively for various outdoor recreation
activities; it also likely has a significant non-use value to county residents. The stream,
however, continues to face increased environmental pressures as land-use activities within its
watershed impact its water quality. As a result, the county is proposing the preservation of
600 acres of land in and around the stream’s boundaries to help reduce the external impact
of this activity. While the specific sites have yet to be chosen, the expected average cost per
acre is $15,000.
To pay for these land acquisitions, the county is planning a ballot initiative proposing a one-
year increase in per-household water bills to cover the cost of the land acquisition. Before
they proceed, however, they want to know if there is an appetite for the policy. Thus, they
contracted with the CED 201 class at Penn State to run a stated preference (contingent
valuation) (SP) survey to help answer the question.
The SP survey was sent out to random sample of county households and was returned by
458 of them. Each household was given a description along with an image (see below) of the
proposed policy along with its pros and cons.
Then, they were asked the following question:
If the Centre County land acquisition plan for Spring Creek was on the ballot in the next election and it cost
your household $___ each quarter over the next year (4 payments of this amount) in higher water bills,
would you vote in favor or against?
____I would vote YES ____I would vote NO
The dollar amounts are one of the following 12 values: ($2,3,5,10,15,17,20,35,50,70,90,170).
a. (20 points) The data returned from the survey in contained the Excel spreadsheet called
Q3_wtp_data.xlsx. The data has three columns: (1) Choice, which is a yes (1) or no (0)
response to the question asked in the survey; (2) the Bid amount
($2,3,5,10,15,17,20,35,50,70,90,170) offered to each household; and (3) the household’s
income. For this question, I want you to use the Choice and Bid variables and plot a
WTP curve based on the household responses. This will be a figure with Bid amounts on
one axis and response rates on another. Does the figure make sense?