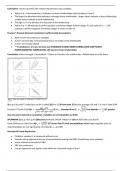
Correlation: Used to quantify the relationship between two variables.
• Value of ρ = 0 (estimated by r) indicates no linear relationships exists between X and Y.
• The larger the absolute value indicates a stronger linear relationship. Larger values indicate a close relationship,
smaller values indicate a weak relationship.
• The sign (+/-) of ρ denotes the direction of the relationship.
• Value of ρ = 1.00 indicates a perfect positive correlation (larger X means larger Y); and value of ρ = −1.00
indicates a perfect negative correlation (larger X means smaller Y)
Pearson’s Product Moment Correlation Coefficirent(r):Assumptions
• Both X and Y are continuous variables
• X and Y are bivariate normal (relationship is normally evenly distributed)
• X and Y are linearly related
• **If conditions 1 or 2 are not met, use SPEARMAN’S RANK ORDER CORRELATION COEFFICIENT
(NONPARAMETRIC CORRELATION-still assume linear relationship)
Correlation-shows strength of association---Closer to 0 weaker the relationship—Relationship must be linear
1)H0:p=0 H1:p≠0 (*2-tailed but can be 1-tailed) 2)df=n-2,CV from chart 3)Take the average of X and Y: X2 and Y2take SUM
̅𝒀
𝚺𝑿𝒀−𝒏𝑿 ̅ 𝟏−𝒓𝟐 𝒓
for Each:X*Y,take SUM 4)𝒓 = 5) r2=_ : Standard Error 𝑺 𝒓 = √ Test Statistic 𝒕 = 6)T greater
̅̅̅̅𝟐)(𝚺𝒚 𝟐−𝒏𝒚
√(𝚺 𝐱 𝟐−𝒏𝒙 ̅̅̅̅̅
𝟐) 𝒏−𝟐 𝒔𝒓
than CV,null is rejected,is correlation. Variables are correleated(r=,p<0.05)
SPEARMAN:1) H0 :ps =0 H1 :ps ≠0 2)Decision,N=#(USE SPEAR TABLE)=CV 3)Rank X&Y:Take Sum,Xrank-
1−6Σ𝑑𝑖2
Yrank,Difference 2:Take Sum 4)𝒓𝒔 = 3 5)T lesser than CV,Null accepted(have to be larger negative value to
𝑛 −𝑛
reject)Variables are not significantly correlated(r s =_,p>0.05)
Assumpt of Linear Regression:
• Predictor variable,X, is measured without error
• Samples along regression line are homoscedastic(meaning that X&Y should have same variance)
• Linear relation must exist b/t X&Y.
• X&Y are continuous
• Line of regression only applies only within the observed range of the X