Quantitative Studies:
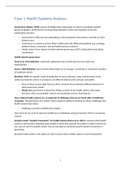
The typical research process and measurement >
Surveys:
Golden rules for a survey:
1. Understanding of the project goal?
a. What do you want to learn?
b. Who is target audience? Demographic characteristics.
2. Keep it simple & use logic. Less is more.
a. Do not add items just for the sake of it (does an item contribute to the project goal?).
3. Field test.
a. Complete the survey yourself.
b. Invite others (from target audience) to complete the survey.
4. Appearance is everything.
Every question could be considered a measurement!
- Question: So, how much pain do you have now? BUT: Maximum pain? Average pain last
week? Pain during activity?
- Question: Do you work? BUT: Full time work? Adjusted work? Paid work?
What is the aim of your measurement?
- Who’s perspective? (Patient or clinician).
o They do not necessarily agree. For example, on the definitions main symptoms of a
disease and on the definitions of success of treatment (surgery).
o Interdisciplinary research methods are needed!
- Objective or subjective?
o In many ‘objective’ measures’ still interpretation form a rater/expert/physician is still
needed. So, validity and reliability should also be tested (e.g., MRI, X-ray).
o To reduce the ‘subjectiveness’ of Patient Reported Outcome Measures (PROMs)
standardization is important (specific formulation and visualization important).
- Disease specific or generic?
- What exactly do you want to measure?
o Theoretical framework.
o Specific definition of the construct.
Seven tips for good survey questions:
1. Question is interpreted in a consistent manner.
2. Question people are willing to answer. Explain and assure confidentially.
3. Question is answered truthfully (e.g., socially desirable answers).
4. Question with a known answer. Assure people have the knowledge or information.
5. Avoid double barrelled questions.
6. Avoid biased terms or wording
7. Pretest your questions. Feedback.
Sources of bias in surveys:
Central tendency bias – avoid extreme responses.
o Solution = equal number of positive and negative statements.
o Set back = difference between ‘slightly agree’ & ‘slightly disagree’?
Acquiescence bias – agree with statements as presented.
Social desirability bias – put oneself in positive perspective.
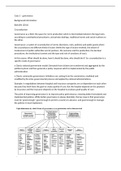
,COSMIN:
COnsensus-based Standards for the selection of health
Measurement INstruments (COSMIN): an initiative aimed at
improving the selection of health care measurement
instruments. The COSMIN taxonomy classifies
measurement properties into three main domains:
Reliability: the domain refers to the degree to which a
measurement is free from measurement error. Are you repeatedly measuring the same? It contains:
Reliability (test-retest) – the proportion of total variance in measurements that is due to ‘true’
differences between patients.
o Repeated measures increase precision; reliability (of the instrument).
o Inter-rater main question: do two (or more) raters give the same score? For example:
Different raters rate same patients on different days. Reflects daily practice.
o Intra-rater main question: does the same rater give the same score?
The same rater(s) on different occasions/moments (short interval can cause
recall bias).
o Stability – reliability asks for stability in a tool; the construct should not have changed
between the two measurements. This is why a short interval between the two
measurements and/or external criteria for stability are needed.
A lot of measurements also ensures that the mean becomes reliable.
Internal consistency – the extent to which all items of a (sub)scale measure the same
construct, assuming the (sub)scale is unidimensional. Do items more or less measure the
same construct? Used for:
o Multi item (or multitask) instrument/PROM.
o Latent (non-observable characteristics like depression, anxiety).
Measurement error - the systematic and random error of a patient’s score that is not
attributed to true changes in the construct to be measured (test-retest). It is expressed in the
standard error of measurement (SEM): (within subject variance).
o SEM indicates the amount of variability or uncertainty in a measurement instrument.
Low SEM = reliable, high SEM = not reliable.
o SEM=var or SEM=SD×1−r.
Validity: the domain refers to the degree to which an
outcome measure measures the construct it supposed to
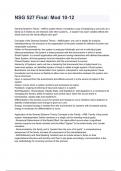
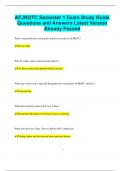
measure. Are you measuring what you want to measure?
- Validity can be used to compare studies and look for
biased results. Example: different rifles aiming a target.
- Problems in validity ask for recalibrating of the tool or - Rifle 2 has systematic deviation
re-thinking the concepts that you are measuring. If the (magnitude and direction) from the true
mean is a wrong value, repeated measures will not value. So, no validity.
solve the problem. - Rifle 3 has a correct mean but no specific
direction of the shots. So, no reliability.
It contains the measurement properties:
Content validity – the extent to which the content of an HR-PRO instrument adequately
covers all the important aspects of the concept it is trying to measure.
o Health-Related Patient-Reported Outcome (HR-PRO) – a measurement instrument
that is self-completed by the patient and provides information about the patient's
health status.
o You should critically appraise:
Relevance = items should be relevant to the construct being measured.
, Comprehensiveness = items should
cover all important aspects of the
construct.
Clarity (comprehensibility) = items
should be clear and understandable
to the target audience.
o Face validity – the degree to which (the
items of) an HR-PRO instrument indeed looks as though it is an adequate reflection of
the construct to be measured.
No strong form of validity but can be important because it can increase
patient acceptance and research credibility.
Criterion validity – the extent to which the scores of an HR-PRO (or other) instrument
adequately reflect a ‘gold standard’ (best or most accurate way to measure the construct).
o Often used in diagnostic research, e.g. range of motion and X-ray.
o There are two main aspects of criterion validity:
Concurrent validity – the extent to which the scores of the instrument match
the scores of the gold standard measured at the same time.
Predictive validity – the extent to which the scores of the instrument can
predict future scores on the gold standard (e.g. predict who will receive a
diagnosis of depression in the future based on the clinical interview).
Construct validity – the extent to which the scores of an HR-PRO instrument are consistent
with hypotheses (e.g. regarding internal relationships, relationships of scores of other
instruments or differences between relevant groups) based on the assumption that the HR-
PRO instrument validly measures the construct to be measured. Factor analyses are used to
assess construct validity and create a ‘gold standard’. Consists of:
o Structural validity – assesses whether the scores of an HR-PRO instrument
adequately reflect the dimensionality of the construct being measured. For example,
if an instrument is designed to measure both anxiety and depression, SV should
demonstrate that these two components can be separately identified and measured.
o Hypotheses-testing - testing different hypotheses related to the instrument's scores.
These hypotheses deal with a-priori expectations about how:
A score on the instrument is related to a score on other instruments.
More or less the same instruments = more or less the same scores
(convergent and discriminant validity).
Differences in scores between groups that are expected to differ (= group
validity).
Building a kind of theoretical framework.
*This hypothesis-testing is different than statistic hypothesis testing!
o Cross-cultural validity - relevant for translated or culturally adapted HR-PRO
instruments. It assesses whether the performance of the items on the translated
version adequately reflects the performance of the items on the original version
(measurement invariance).
Responsiveness: the ability of an HR-PRO instrument to detect change over time in the construct
being measured. In other words, it is about how well an instrument can measure changes in a
patient's health status.
- Good responsiveness is important for evaluating treatments, monitoring health status and
comparing the effectiveness of different treatments.
- Interpretability: the extent to which one can assign qualitative meaning, i.e. clinical or commonly
understood associations, to an instrument's quantitative scores or change in scores (e.g.
interpreting IQ scores interpreting blood pressure scores).
, Comparing measurements:
Levels of measurements:
Dichotomous variables – only two possible values or
categories. Examples = Yes/No, On/Off, Male/Female.
Categorical variables – nominal or ordinal scale.
o Nominal scale – includes more than two
categories, but these have no inherent order.
Categories are mutually exclusive and cannot
be compared numerically.
Examples = hair colour (blonde, brown, black), nationality.
o Ordinal scale - contains ordered categories, where the order is important but the
distances between values are not equal. Categories are also mutually exclusive, but
you can rank.
Examples = rating scales (e.g. poor, average, good), severity of pain (1-7).
Sometime a (4-) point scale causes ‘forced choice’.
Continuous variables – measures variables that can take any value within a certain range,
theoretically allowing them to have infinite values. Includes interval and ratio scales.
o Interval scale – the distances between values are equal, but there is no absolute zero.
For example, you can say that 20°C is warmer than 10°C, but 0°C does not mean the
absence of temperature.
Not all ‘continuous scales’ are truly continuous (e.g., IQ test, from 65 to 85 is
not similar as from 135 to 155).
o Ratio scale – here the distances are equal and there is an absolute zero. For example,
you can say that 0 kilogram means the absence of weight, and that 10 kg is really
double that of 5 kg (also examples like length, time).
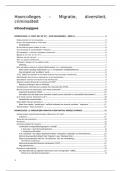
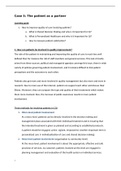
Statistical measures: assessing the effectiveness of a (diagnostic) test.
Sensitivity – the ability of a test to correctly identify actually sick people. It is the ratio of
correct positive results to the total number of actual positive cases.
o High sensitivity means that the test is good at detecting the disease. This is
especially important in screening tests, where it is crucial to identify as
many sick people as possible.
TP a
o Formula = =
TP+ FN a+c
Specificity – The ability of a test to correctly
identify healthy people. It is the ratio of
correct negative results to the total number Example: Imagine we have a new test for chronically ill
of true negative cases. people, and we test 1,000 people:
o High specificity means that the test TP 150
is good at ruling out the disease in - Sensitivity = = = 75%.
TP+ FN 150+50
healthy people. This is important to TN 750
avoid unnecessary worry or - Specificity = = = 93,75%.
TN + FP 750+50
treatment in healthy people. TP 150
TN d - PV+ = = = 75%.
o Formula = = . TP+ FN 150+50
TN + FP d +b TN 750
Predictive value of a positive test – indicates - PV- = = = 93,75%.
TN + FP 750+50
how reliable a positive result is. It is the
probability that a person actually has the Sensitivity of 75% means that the test correctly detects
disease, given that the test is positive. the presence of the disease in 75% of cases.
Specificity of 93.75% means that the test correctly
indicates the absence of the disease in 93.75% of cases.
PV+ of 75% means that 75% of people with a positive test
The typical research process and measurement >
Surveys:
Golden rules for a survey:
1. Understanding of the project goal?
a. What do you want to learn?
b. Who is target audience? Demographic characteristics.
2. Keep it simple & use logic. Less is more.
a. Do not add items just for the sake of it (does an item contribute to the project goal?).
3. Field test.
a. Complete the survey yourself.
b. Invite others (from target audience) to complete the survey.
4. Appearance is everything.
Every question could be considered a measurement!
- Question: So, how much pain do you have now? BUT: Maximum pain? Average pain last
week? Pain during activity?
- Question: Do you work? BUT: Full time work? Adjusted work? Paid work?
What is the aim of your measurement?
- Who’s perspective? (Patient or clinician).
o They do not necessarily agree. For example, on the definitions main symptoms of a
disease and on the definitions of success of treatment (surgery).
o Interdisciplinary research methods are needed!
- Objective or subjective?
o In many ‘objective’ measures’ still interpretation form a rater/expert/physician is still
needed. So, validity and reliability should also be tested (e.g., MRI, X-ray).
o To reduce the ‘subjectiveness’ of Patient Reported Outcome Measures (PROMs)
standardization is important (specific formulation and visualization important).
- Disease specific or generic?
- What exactly do you want to measure?
o Theoretical framework.
o Specific definition of the construct.
Seven tips for good survey questions:
1. Question is interpreted in a consistent manner.
2. Question people are willing to answer. Explain and assure confidentially.
3. Question is answered truthfully (e.g., socially desirable answers).
4. Question with a known answer. Assure people have the knowledge or information.
5. Avoid double barrelled questions.
6. Avoid biased terms or wording
7. Pretest your questions. Feedback.
Sources of bias in surveys:
Central tendency bias – avoid extreme responses.
o Solution = equal number of positive and negative statements.
o Set back = difference between ‘slightly agree’ & ‘slightly disagree’?
Acquiescence bias – agree with statements as presented.
Social desirability bias – put oneself in positive perspective.
,COSMIN:
COnsensus-based Standards for the selection of health
Measurement INstruments (COSMIN): an initiative aimed at
improving the selection of health care measurement
instruments. The COSMIN taxonomy classifies
measurement properties into three main domains:
Reliability: the domain refers to the degree to which a
measurement is free from measurement error. Are you repeatedly measuring the same? It contains:
Reliability (test-retest) – the proportion of total variance in measurements that is due to ‘true’
differences between patients.
o Repeated measures increase precision; reliability (of the instrument).
o Inter-rater main question: do two (or more) raters give the same score? For example:
Different raters rate same patients on different days. Reflects daily practice.
o Intra-rater main question: does the same rater give the same score?
The same rater(s) on different occasions/moments (short interval can cause
recall bias).
o Stability – reliability asks for stability in a tool; the construct should not have changed
between the two measurements. This is why a short interval between the two
measurements and/or external criteria for stability are needed.
A lot of measurements also ensures that the mean becomes reliable.
Internal consistency – the extent to which all items of a (sub)scale measure the same
construct, assuming the (sub)scale is unidimensional. Do items more or less measure the
same construct? Used for:
o Multi item (or multitask) instrument/PROM.
o Latent (non-observable characteristics like depression, anxiety).
Measurement error - the systematic and random error of a patient’s score that is not
attributed to true changes in the construct to be measured (test-retest). It is expressed in the
standard error of measurement (SEM): (within subject variance).
o SEM indicates the amount of variability or uncertainty in a measurement instrument.
Low SEM = reliable, high SEM = not reliable.
o SEM=var or SEM=SD×1−r.
Validity: the domain refers to the degree to which an
outcome measure measures the construct it supposed to
measure. Are you measuring what you want to measure?
- Validity can be used to compare studies and look for
biased results. Example: different rifles aiming a target.
- Problems in validity ask for recalibrating of the tool or - Rifle 2 has systematic deviation
re-thinking the concepts that you are measuring. If the (magnitude and direction) from the true
mean is a wrong value, repeated measures will not value. So, no validity.
solve the problem. - Rifle 3 has a correct mean but no specific
direction of the shots. So, no reliability.
It contains the measurement properties:
Content validity – the extent to which the content of an HR-PRO instrument adequately
covers all the important aspects of the concept it is trying to measure.
o Health-Related Patient-Reported Outcome (HR-PRO) – a measurement instrument
that is self-completed by the patient and provides information about the patient's
health status.
o You should critically appraise:
Relevance = items should be relevant to the construct being measured.
, Comprehensiveness = items should
cover all important aspects of the
construct.
Clarity (comprehensibility) = items
should be clear and understandable
to the target audience.
o Face validity – the degree to which (the
items of) an HR-PRO instrument indeed looks as though it is an adequate reflection of
the construct to be measured.
No strong form of validity but can be important because it can increase
patient acceptance and research credibility.
Criterion validity – the extent to which the scores of an HR-PRO (or other) instrument
adequately reflect a ‘gold standard’ (best or most accurate way to measure the construct).
o Often used in diagnostic research, e.g. range of motion and X-ray.
o There are two main aspects of criterion validity:
Concurrent validity – the extent to which the scores of the instrument match
the scores of the gold standard measured at the same time.
Predictive validity – the extent to which the scores of the instrument can
predict future scores on the gold standard (e.g. predict who will receive a
diagnosis of depression in the future based on the clinical interview).
Construct validity – the extent to which the scores of an HR-PRO instrument are consistent
with hypotheses (e.g. regarding internal relationships, relationships of scores of other
instruments or differences between relevant groups) based on the assumption that the HR-
PRO instrument validly measures the construct to be measured. Factor analyses are used to
assess construct validity and create a ‘gold standard’. Consists of:
o Structural validity – assesses whether the scores of an HR-PRO instrument
adequately reflect the dimensionality of the construct being measured. For example,
if an instrument is designed to measure both anxiety and depression, SV should
demonstrate that these two components can be separately identified and measured.
o Hypotheses-testing - testing different hypotheses related to the instrument's scores.
These hypotheses deal with a-priori expectations about how:
A score on the instrument is related to a score on other instruments.
More or less the same instruments = more or less the same scores
(convergent and discriminant validity).
Differences in scores between groups that are expected to differ (= group
validity).
Building a kind of theoretical framework.
*This hypothesis-testing is different than statistic hypothesis testing!
o Cross-cultural validity - relevant for translated or culturally adapted HR-PRO
instruments. It assesses whether the performance of the items on the translated
version adequately reflects the performance of the items on the original version
(measurement invariance).
Responsiveness: the ability of an HR-PRO instrument to detect change over time in the construct
being measured. In other words, it is about how well an instrument can measure changes in a
patient's health status.
- Good responsiveness is important for evaluating treatments, monitoring health status and
comparing the effectiveness of different treatments.
- Interpretability: the extent to which one can assign qualitative meaning, i.e. clinical or commonly
understood associations, to an instrument's quantitative scores or change in scores (e.g.
interpreting IQ scores interpreting blood pressure scores).
, Comparing measurements:
Levels of measurements:
Dichotomous variables – only two possible values or
categories. Examples = Yes/No, On/Off, Male/Female.
Categorical variables – nominal or ordinal scale.
o Nominal scale – includes more than two
categories, but these have no inherent order.
Categories are mutually exclusive and cannot
be compared numerically.
Examples = hair colour (blonde, brown, black), nationality.
o Ordinal scale - contains ordered categories, where the order is important but the
distances between values are not equal. Categories are also mutually exclusive, but
you can rank.
Examples = rating scales (e.g. poor, average, good), severity of pain (1-7).
Sometime a (4-) point scale causes ‘forced choice’.
Continuous variables – measures variables that can take any value within a certain range,
theoretically allowing them to have infinite values. Includes interval and ratio scales.
o Interval scale – the distances between values are equal, but there is no absolute zero.
For example, you can say that 20°C is warmer than 10°C, but 0°C does not mean the
absence of temperature.
Not all ‘continuous scales’ are truly continuous (e.g., IQ test, from 65 to 85 is
not similar as from 135 to 155).
o Ratio scale – here the distances are equal and there is an absolute zero. For example,
you can say that 0 kilogram means the absence of weight, and that 10 kg is really
double that of 5 kg (also examples like length, time).
Statistical measures: assessing the effectiveness of a (diagnostic) test.
Sensitivity – the ability of a test to correctly identify actually sick people. It is the ratio of
correct positive results to the total number of actual positive cases.
o High sensitivity means that the test is good at detecting the disease. This is
especially important in screening tests, where it is crucial to identify as
many sick people as possible.
TP a
o Formula = =
TP+ FN a+c
Specificity – The ability of a test to correctly
identify healthy people. It is the ratio of
correct negative results to the total number Example: Imagine we have a new test for chronically ill
of true negative cases. people, and we test 1,000 people:
o High specificity means that the test TP 150
is good at ruling out the disease in - Sensitivity = = = 75%.
TP+ FN 150+50
healthy people. This is important to TN 750
avoid unnecessary worry or - Specificity = = = 93,75%.
TN + FP 750+50
treatment in healthy people. TP 150
TN d - PV+ = = = 75%.
o Formula = = . TP+ FN 150+50
TN + FP d +b TN 750
Predictive value of a positive test – indicates - PV- = = = 93,75%.
TN + FP 750+50
how reliable a positive result is. It is the
probability that a person actually has the Sensitivity of 75% means that the test correctly detects
disease, given that the test is positive. the presence of the disease in 75% of cases.
Specificity of 93.75% means that the test correctly
indicates the absence of the disease in 93.75% of cases.
PV+ of 75% means that 75% of people with a positive test