Lecture week 1 Monday
Introduction lecture
● We’re going to use the software Stata.
● We’re going to look at data where the linear assumption isn’t met (curves, plateaus).
● 20 modules
● Q&A sessions are online
● 3 partials exams, are rather short. People perform better this way.
● It’s an intensive course, so keep up.
● Strongly recommended to use SPSS: easily records missing values, easily to store data, easier
to use simple analysis.
● Difficult analyses in Stata, but make dataset in SPSS.
● Please have all the software running on your computer before you start the first module.
● When you have questions, put them on the discussion board.
● Fellow students can answer these questions.
● When you don’t pass, you have to retake all three exams, because they are put together for
the re-exam.
Lecture module 1
● Watch the webinar from the stata website (link in slides)
● Additionally: stata cheatsheets (quickly check how things work)
Lecture module 2 GLMs and GLM building
● Glossary in Brightspace, where all the important terms are explained.
1
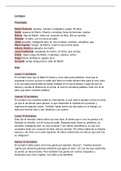
,The relationship between sample parameters and underlying population parameters.
● When you take a sample of the population, it is important to explain how the sample
arrived. A lot of researchers don’t do that. It helps you understand if the sample is applicable
to the entire population.
2
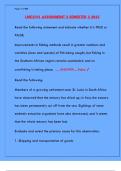
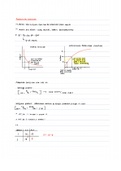
,The blue line is the model, without the error term E.
The best line is the one that produces the smallest sum of squared distances when measured from
each observed point to the ‘blue line’. This ‘Ordinary Least Squares’ (OLS) method is the standard
technique for estimating the parameters in linear regression models.
3
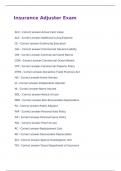
, The formula you should know:
4
Introduction lecture
● We’re going to use the software Stata.
● We’re going to look at data where the linear assumption isn’t met (curves, plateaus).
● 20 modules
● Q&A sessions are online
● 3 partials exams, are rather short. People perform better this way.
● It’s an intensive course, so keep up.
● Strongly recommended to use SPSS: easily records missing values, easily to store data, easier
to use simple analysis.
● Difficult analyses in Stata, but make dataset in SPSS.
● Please have all the software running on your computer before you start the first module.
● When you have questions, put them on the discussion board.
● Fellow students can answer these questions.
● When you don’t pass, you have to retake all three exams, because they are put together for
the re-exam.
Lecture module 1
● Watch the webinar from the stata website (link in slides)
● Additionally: stata cheatsheets (quickly check how things work)
Lecture module 2 GLMs and GLM building
● Glossary in Brightspace, where all the important terms are explained.
1
,The relationship between sample parameters and underlying population parameters.
● When you take a sample of the population, it is important to explain how the sample
arrived. A lot of researchers don’t do that. It helps you understand if the sample is applicable
to the entire population.
2
,The blue line is the model, without the error term E.
The best line is the one that produces the smallest sum of squared distances when measured from
each observed point to the ‘blue line’. This ‘Ordinary Least Squares’ (OLS) method is the standard
technique for estimating the parameters in linear regression models.
3
, The formula you should know:
4