2
WGU C635 Task 4: Capstone Written Project Chapters 4-5
|Latest Update with Complete Solution
Jennifer Doyen
Western Governors University
C635 Task 4: Capstone Written Project Chapters 4-5
Shanna Childers
Mar 7, 2025
Contents
Chapter 4: Results ............................................................................................................................3
Results ..........................................................................................................................................3
Data Analysis ...............................................................................................................................3
The Research Question Answered ...............................................................................................6
Chapter 5: Conclusions ....................................................................................................................7
Overview ......................................................................................................................................7
Solutions .......................................................................................................................................7
Strengths and Weaknesses............................................................................................................7
Influential Factors ........................................................................................................................8
Further Investigation ....................................................................................................................8
Appendix A Curriculum Unit .........................................................................................................10
Appendix B Data Gathering Instruments .......................................................................................20
Appendix C Forms .........................................................................................................................40
, 3
Chapter.. 4:.. Results
Results
This..research..study..was..conducted..to..determine..if..the..use..of..a..calculator..improves..ac
hievement..in..sixth..graders,..after..receiving..nine..day..of..instruction..on..both..paper..pencil..and..ca
lculator..use..on..the..topic..of..multiplication..and..division..of..fractions,..whole..numbers,..and..mixed
..numbers...At..the..conclusion..of..the..study,..it..was..determined..that..providing..instruction..on..both
..paper..pencil..and..calculator..methods..to..solve..fraction..multiplication..and..division..increases..st
udents’..achievement...The..student’s..pre-assessment..and..post-
assessment..scores..showed..a..significant..increase..in..achievement...The..participants..average..on..t
he..pre-assessment..was..13.8,..which..increased..to..22.6..on..the..post-assessment.
Data..Analysis
All..ten..participants..were..given..a..pre-
assessment..prior..to..beginning..the..nine..days..of..instruction...The..assessment..asked..students..to..d
emonstrate..their..knowledge..of..multiplying..and..dividing..fractions,..whole..numbers..and..mixed..n
umbers...Students..were..provided..with..a..Texas..Instrument..TI-
30IIXS..scientific..calculator..to..use..if..needed...Using..a..rubric,..the..lowest..score..possible..was..ze
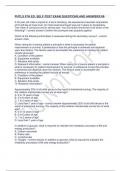
ro,..while..the..highest..possible..score..was..thirty...The..student’s..pre-
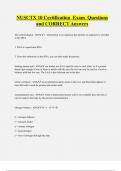
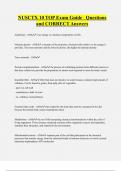
assessment..scores..were..6,..7,..10,..11,..13,..14,..17,..19,..19,..and..22...The..average..of..pre-
assessment..scores..was..13.8,..which..reflects..a..low..understanding..of..the..task..at..hand...During..th
e..pre-
assessment,..there..was..noticeable..anxiousness..amongst..students...Several..students..exerted..sighs
,..were..observed..staring..into..space,..rubbing..their..hands,..cracking..knuckles,..or..tapping..their..pe
ncils...Pre-..assessment..scores..are..provided..in..the..scatter..plot..below.
, 4
30
28
26
24
22
20
18
16
14
12
10
8
6
4
2
0
0 1 2 3 4 5 6 7 8 9 10 11
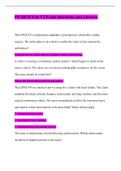
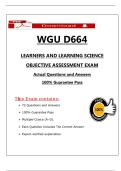
The..post-
assessment..scores..were..14,..16,..18,..19,..22,..27,..28,..28,..30...The..averages..of..these..scores..was..2
2.6,..which..is..an..8.8..increase..from..the..pre-
assessment...The..greatest..increase..in..score..was..participant..number..9999,..who..has..pre-
assessment..score..of..14,..and..a..post-
assessment..score..of..27...The..smallest..increase..in..score..was..a..5-
point..gain..amongst..participants..1201,..7821,..and..1407...Participant..2626..scored..the..highest..on..
the..pre-
assessment..with..a..score..of..22/30..and..was..the..only..participant..to..score..a..perfect..of..30/30..on..t
he..post-
assessment...This..student..exhibited..the..least..amount..of..anxiety..during..the..assessments...The..res
earcher..noticed..significantly..less..non-..verbal..anxiousness..performance..habits...Post-
assessment..scores..are..presented..in..the..scatter..plot..below.
, 5
Post. . Assessment. . Scores
12
10
8
6
4
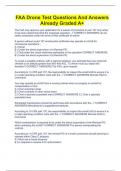
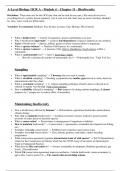
The..data..2graph..below..shows..a..double-line..graph..representing..the..comparison..of..pre-
assessment..and..p0ost-assessment..scores...From..this..data..chart..we..can..see..an..increase..in
0 1 2 3 4 5 6 7 8 9 10 11
participants..scores..from..the..pre-assessment..to..the..post-assessment...The..t-
test..performed..calculates..a..p-
value..score..of..0.00188615..which..shows..a..significant..difference..in..pre-..and..post-
assessment..scores..which..represents..a..positive..impact.
Pre-Assessment.. and.. Post-
35 Assessment Scores
30
25
20
15
10
5
0
1 2 3 4 5 6 7 8 9 10 11
Pre-Test Post-Test
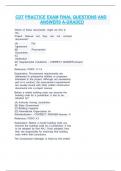
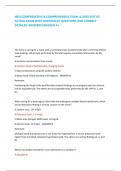
When..looking..at..each..question..individually,..the..results..are..shown..in..the..table..below...
On..the..pre-
assessment..question..one..was..answered..correctly..by..eight..students,..the..two..who..missed..the..qu
estion..only..missed..it..due..to..a..computational..error,..it..appeared..that..they..understood..the..process
...Students..struggled..with..questions..five,..seven..and..twelve..the..most..with..answering..0,..1,..1
WGU C635 Task 4: Capstone Written Project Chapters 4-5
|Latest Update with Complete Solution
Jennifer Doyen
Western Governors University
C635 Task 4: Capstone Written Project Chapters 4-5
Shanna Childers
Mar 7, 2025
Contents
Chapter 4: Results ............................................................................................................................3
Results ..........................................................................................................................................3
Data Analysis ...............................................................................................................................3
The Research Question Answered ...............................................................................................6
Chapter 5: Conclusions ....................................................................................................................7
Overview ......................................................................................................................................7
Solutions .......................................................................................................................................7
Strengths and Weaknesses............................................................................................................7
Influential Factors ........................................................................................................................8
Further Investigation ....................................................................................................................8
Appendix A Curriculum Unit .........................................................................................................10
Appendix B Data Gathering Instruments .......................................................................................20
Appendix C Forms .........................................................................................................................40
, 3
Chapter.. 4:.. Results
Results
This..research..study..was..conducted..to..determine..if..the..use..of..a..calculator..improves..ac
hievement..in..sixth..graders,..after..receiving..nine..day..of..instruction..on..both..paper..pencil..and..ca
lculator..use..on..the..topic..of..multiplication..and..division..of..fractions,..whole..numbers,..and..mixed
..numbers...At..the..conclusion..of..the..study,..it..was..determined..that..providing..instruction..on..both
..paper..pencil..and..calculator..methods..to..solve..fraction..multiplication..and..division..increases..st
udents’..achievement...The..student’s..pre-assessment..and..post-
assessment..scores..showed..a..significant..increase..in..achievement...The..participants..average..on..t
he..pre-assessment..was..13.8,..which..increased..to..22.6..on..the..post-assessment.
Data..Analysis
All..ten..participants..were..given..a..pre-
assessment..prior..to..beginning..the..nine..days..of..instruction...The..assessment..asked..students..to..d
emonstrate..their..knowledge..of..multiplying..and..dividing..fractions,..whole..numbers..and..mixed..n
umbers...Students..were..provided..with..a..Texas..Instrument..TI-
30IIXS..scientific..calculator..to..use..if..needed...Using..a..rubric,..the..lowest..score..possible..was..ze
ro,..while..the..highest..possible..score..was..thirty...The..student’s..pre-
assessment..scores..were..6,..7,..10,..11,..13,..14,..17,..19,..19,..and..22...The..average..of..pre-
assessment..scores..was..13.8,..which..reflects..a..low..understanding..of..the..task..at..hand...During..th
e..pre-
assessment,..there..was..noticeable..anxiousness..amongst..students...Several..students..exerted..sighs
,..were..observed..staring..into..space,..rubbing..their..hands,..cracking..knuckles,..or..tapping..their..pe
ncils...Pre-..assessment..scores..are..provided..in..the..scatter..plot..below.
, 4
30
28
26
24
22
20
18
16
14
12
10
8
6
4
2
0
0 1 2 3 4 5 6 7 8 9 10 11
The..post-
assessment..scores..were..14,..16,..18,..19,..22,..27,..28,..28,..30...The..averages..of..these..scores..was..2
2.6,..which..is..an..8.8..increase..from..the..pre-
assessment...The..greatest..increase..in..score..was..participant..number..9999,..who..has..pre-
assessment..score..of..14,..and..a..post-
assessment..score..of..27...The..smallest..increase..in..score..was..a..5-
point..gain..amongst..participants..1201,..7821,..and..1407...Participant..2626..scored..the..highest..on..
the..pre-
assessment..with..a..score..of..22/30..and..was..the..only..participant..to..score..a..perfect..of..30/30..on..t
he..post-
assessment...This..student..exhibited..the..least..amount..of..anxiety..during..the..assessments...The..res
earcher..noticed..significantly..less..non-..verbal..anxiousness..performance..habits...Post-
assessment..scores..are..presented..in..the..scatter..plot..below.
, 5
Post. . Assessment. . Scores
12
10
8
6
4
The..data..2graph..below..shows..a..double-line..graph..representing..the..comparison..of..pre-
assessment..and..p0ost-assessment..scores...From..this..data..chart..we..can..see..an..increase..in
0 1 2 3 4 5 6 7 8 9 10 11
participants..scores..from..the..pre-assessment..to..the..post-assessment...The..t-
test..performed..calculates..a..p-
value..score..of..0.00188615..which..shows..a..significant..difference..in..pre-..and..post-
assessment..scores..which..represents..a..positive..impact.
Pre-Assessment.. and.. Post-
35 Assessment Scores
30
25
20
15
10
5
0
1 2 3 4 5 6 7 8 9 10 11
Pre-Test Post-Test
When..looking..at..each..question..individually,..the..results..are..shown..in..the..table..below...
On..the..pre-
assessment..question..one..was..answered..correctly..by..eight..students,..the..two..who..missed..the..qu
estion..only..missed..it..due..to..a..computational..error,..it..appeared..that..they..understood..the..process
...Students..struggled..with..questions..five,..seven..and..twelve..the..most..with..answering..0,..1,..1