UCF FINAL QMB 3200 STACEY BROOK SUMMER '23 -
IMPORTANT INFO IN FIRST FLASHCARD 2025 Set
Dataset - Correct Answer-all the data collected for a particular analysis
Data - Correct Answer-The facts & figures collected, analyzed, and summarized for
presentation and interpretation.
Element - Correct Answer-The entity on which data is collected.
Variable - Correct Answer-a characteristic of interest of an element.
Observation - Correct Answer-The variables associated with an individual element.
Categorical Data - Correct Answer-Use numeric or ordinal values of measurement of
categories.
Quantitative Data - Correct Answer-use numeric (quantitative) measures
,Cross-sectional Data - Correct Answer-data collected at a similar point in
time.
Time Series - Correct Answer-data collected over several time periods.
Panel Data - Correct Answer-combination of cross-sectional and time series data.
Regression Equation Output - Correct Answer-The intercept row contains the estimated
results for
the y intercept and the next row contains the
estimated results about the independent variable.
The column Coefficients are b 0 and b 1 , respectively.
The column Standard Error is the standard deviation
of b 0 and b 1
The column t Stat is the t statistic [𝑡 = b1/sb1].
The column p-value is the p-value associated with
the t stat.
To determine if we reject Ho, if the p-value ≤ α,
where 𝐻𝑜: 𝛽1 = 0
The information to the right of the p-value column
,allows us to develop confidence interval estimates of
the y intercept and slope of the estimated regression
equation.
Regression Summary Output - Correct Answer-Multiple R (sample correlation coefficient)R-
square (coefficient of determination)Adjusted R-square (not applicable for a simple
linearregression)Standard Error (estimate of σ)Observations (n)
Volume - Correct Answer-The number of observations
Velocity - Correct Answer-the speed at which data is collected
variety - Correct Answer-the forms of data are of different types
veracity - Correct Answer-the reliability of the data generated
Descriptive Statistics - Correct Answer-Describes data or variables
Population - Correct Answer-Is the set of all data/variables of a statistical analysis.
Sample - Correct Answer-is a subset of the population
, Statistical Inference: - Correct Answer-Uses data from a sample to make estimates and test
hypothesis about the characteristics of a population.
What does row 1 usually contain in Excel? - Correct Answer-Typically contains the variable's
names.
What does Column A usually contain in Excel? - Correct Answer-contains the elements; and
the rest of the
worksheet contains the data in the dataset.
How do you calculate the mean in excel? - Correct Answer-=Average
How do you calculate the median in excel? - Correct Answer-=median
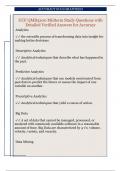
What is data analytics? - Correct Answer-the scientific process of transforming data
for decision making. There are three broad areas of
data analytics.
Descriptive Analytics - Correct Answer-describe what has happened in the past.
Predictive Analytics - Correct Answer-uses statistical models from
past data to predict the future [forecasting] or access
the impact of one variable on another [inference].
IMPORTANT INFO IN FIRST FLASHCARD 2025 Set
Dataset - Correct Answer-all the data collected for a particular analysis
Data - Correct Answer-The facts & figures collected, analyzed, and summarized for
presentation and interpretation.
Element - Correct Answer-The entity on which data is collected.
Variable - Correct Answer-a characteristic of interest of an element.
Observation - Correct Answer-The variables associated with an individual element.
Categorical Data - Correct Answer-Use numeric or ordinal values of measurement of
categories.
Quantitative Data - Correct Answer-use numeric (quantitative) measures
,Cross-sectional Data - Correct Answer-data collected at a similar point in
time.
Time Series - Correct Answer-data collected over several time periods.
Panel Data - Correct Answer-combination of cross-sectional and time series data.
Regression Equation Output - Correct Answer-The intercept row contains the estimated
results for
the y intercept and the next row contains the
estimated results about the independent variable.
The column Coefficients are b 0 and b 1 , respectively.
The column Standard Error is the standard deviation
of b 0 and b 1
The column t Stat is the t statistic [𝑡 = b1/sb1].
The column p-value is the p-value associated with
the t stat.
To determine if we reject Ho, if the p-value ≤ α,
where 𝐻𝑜: 𝛽1 = 0
The information to the right of the p-value column
,allows us to develop confidence interval estimates of
the y intercept and slope of the estimated regression
equation.
Regression Summary Output - Correct Answer-Multiple R (sample correlation coefficient)R-
square (coefficient of determination)Adjusted R-square (not applicable for a simple
linearregression)Standard Error (estimate of σ)Observations (n)
Volume - Correct Answer-The number of observations
Velocity - Correct Answer-the speed at which data is collected
variety - Correct Answer-the forms of data are of different types
veracity - Correct Answer-the reliability of the data generated
Descriptive Statistics - Correct Answer-Describes data or variables
Population - Correct Answer-Is the set of all data/variables of a statistical analysis.
Sample - Correct Answer-is a subset of the population
, Statistical Inference: - Correct Answer-Uses data from a sample to make estimates and test
hypothesis about the characteristics of a population.
What does row 1 usually contain in Excel? - Correct Answer-Typically contains the variable's
names.
What does Column A usually contain in Excel? - Correct Answer-contains the elements; and
the rest of the
worksheet contains the data in the dataset.
How do you calculate the mean in excel? - Correct Answer-=Average
How do you calculate the median in excel? - Correct Answer-=median
What is data analytics? - Correct Answer-the scientific process of transforming data
for decision making. There are three broad areas of
data analytics.
Descriptive Analytics - Correct Answer-describe what has happened in the past.
Predictive Analytics - Correct Answer-uses statistical models from
past data to predict the future [forecasting] or access
the impact of one variable on another [inference].