CHAPTER 8
SOLUTIONS TO B EXERCISES
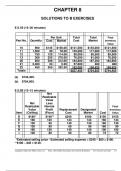
E 8.1B (15–20 minutes)
Per Unit Total Total Final
Part No. Quantity Cost Market Cost Market Inventory
Value
10 900 $135 $150.00 $121,500 $135,000 $121,500
11 1,500 90 78.00 135,000 117,000 117,000
12 750 120 114.00 90,000 85,500 85,500
13 300 255 270.00 76,500 81,000 76,500
20 600 308 312.00 184,800 187,200 184,800
21 2,400 24 0.20 57,600 480 480
22 450 360 352.50 162,000 158,625 158,625
Totals $827,400 $764,805 $744,405
(a) $744,405.
(b) $764,805.
E 8.2B (10–15 minutes)
Net
Realizable
Value
Net Less
Realizable Normal Final
Value Profit Replacement Designated Inventory
Item (Ceiling) (Floor) Cost Market Cost Value
D $180* $140** $240 $180 $150 $150
E 160 120 144 144 160 144
F 130 90 140 130 160 130
G 130 90 60 90 160 90
H 160 120 140 140 100 100
I 120 80 60 80 72 72
*Estimated selling price - Estimated selling expense = $240 – $60 = $180.
**$180 – $40 = $140.
Copyright © 2022 John Wiley & Sons, Inc. Kieso, Intermediate Accounting, 18/e, Exercise B Solutions (For Instructor Use Only) 8-1
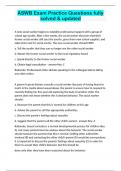
,E 8.3B (15–20 minutes)
Net Real.
Value
Cost Net Less Designated Final
Item per Replacement Realizable Normal Market Inventory
No. Unit Cost Value Profit Value LCM Quantity Value
(Ceiling) (Floor)
A $8.10 $8.00 $8.65* $7.75** $8.00 $8.00 1,200 $ 9,600
B 6.00 5.60 5.55 5.05 5.55 5.55 600 3,330
C 5.50 5.00 6.60 5.60 5.60 5.50 200 1,100***
D 7.25 7.50 7.50 6.60 7.50 7.25 700
5,075***
E 2.10 2.00 2.15 1.95 2.00 2.00 1,000 2,000
F 4.05 4.00 4.60 3.85 4.00 4.00 500 2,000
G 8.75 8.15 8.40 7.90 8.15 8.15 2,000 16,300
H 9.95 9.00 10.20 9.20 9.20 9.20 300 2,760
$42,165
*Estimated selling price - Estimated selling expense = $9.00 – $0.35 = $8.65.
**$8.65 – $0.90 = $7.75.
***Cost is used because it is lower than designated market value.
E 8.4B (10–15 minutes)
(a) 12/31/25 Cost of Goods Sold ............................ 47,500*
Inventory .................................... 47,500
*$865,000 – $817,500
12/31/26l Cost of Goods Sold ............................ 37,500**
Inventory .................................... 37,500
**$1,025,000 – $987,500
8-2 Copyright © 2022 John Wiley & Sons, Inc. Kieso, Intermediate Accounting, 18/e, Exercise B Solutions (For Instructor Use Only)
,E 8.4B (Continued)
(b) 12/31/25
Inventory Loss.................................. 47,500
Inventory
.................................................. 47,500
12/31/26 Inventory Loss.....................................
37,500*
Inventory .....................................
37,500
(c) Both methods of recording LCNRV adjustments have the same effect
on net income.
Copyright © 2022 John Wiley & Sons, Inc. Kieso, Intermediate Accounting, 18/e, Exercise B Solutions (For Instructor Use Only) 8-3
, E 8.5B (15-20 minutes)
Net realizable value (ceiling) $56 – $18 = $38*
Net realizable value less normal profit (floor) $38* – $4 = $34
Replacement cost $40
Designated market $38* Ceiling
Cost (Incorrect valuation) $48**
LCNRV $38*
$48** figure used – $38 correct value per unit = $10 per unit.
$10 X 5,000 units = $50,000.
If ending inventory is overstated, net income will be overstated.
If beginning inventory is overstated, net income will be understated.
Therefore, net income for 2025 was overstated by $50,000 and net income for
2026 was understated by $50,000. The impact will net out to zero after the two
years, but each year will be misstated.
8-4 Copyright © 2022 John Wiley & Sons, Inc. Kieso, Intermediate Accounting, 18/e, Exercise B Solutions (For Instructor Use Only)
SOLUTIONS TO B EXERCISES
E 8.1B (15–20 minutes)
Per Unit Total Total Final
Part No. Quantity Cost Market Cost Market Inventory
Value
10 900 $135 $150.00 $121,500 $135,000 $121,500
11 1,500 90 78.00 135,000 117,000 117,000
12 750 120 114.00 90,000 85,500 85,500
13 300 255 270.00 76,500 81,000 76,500
20 600 308 312.00 184,800 187,200 184,800
21 2,400 24 0.20 57,600 480 480
22 450 360 352.50 162,000 158,625 158,625
Totals $827,400 $764,805 $744,405
(a) $744,405.
(b) $764,805.
E 8.2B (10–15 minutes)
Net
Realizable
Value
Net Less
Realizable Normal Final
Value Profit Replacement Designated Inventory
Item (Ceiling) (Floor) Cost Market Cost Value
D $180* $140** $240 $180 $150 $150
E 160 120 144 144 160 144
F 130 90 140 130 160 130
G 130 90 60 90 160 90
H 160 120 140 140 100 100
I 120 80 60 80 72 72
*Estimated selling price - Estimated selling expense = $240 – $60 = $180.
**$180 – $40 = $140.
Copyright © 2022 John Wiley & Sons, Inc. Kieso, Intermediate Accounting, 18/e, Exercise B Solutions (For Instructor Use Only) 8-1
,E 8.3B (15–20 minutes)
Net Real.
Value
Cost Net Less Designated Final
Item per Replacement Realizable Normal Market Inventory
No. Unit Cost Value Profit Value LCM Quantity Value
(Ceiling) (Floor)
A $8.10 $8.00 $8.65* $7.75** $8.00 $8.00 1,200 $ 9,600
B 6.00 5.60 5.55 5.05 5.55 5.55 600 3,330
C 5.50 5.00 6.60 5.60 5.60 5.50 200 1,100***
D 7.25 7.50 7.50 6.60 7.50 7.25 700
5,075***
E 2.10 2.00 2.15 1.95 2.00 2.00 1,000 2,000
F 4.05 4.00 4.60 3.85 4.00 4.00 500 2,000
G 8.75 8.15 8.40 7.90 8.15 8.15 2,000 16,300
H 9.95 9.00 10.20 9.20 9.20 9.20 300 2,760
$42,165
*Estimated selling price - Estimated selling expense = $9.00 – $0.35 = $8.65.
**$8.65 – $0.90 = $7.75.
***Cost is used because it is lower than designated market value.
E 8.4B (10–15 minutes)
(a) 12/31/25 Cost of Goods Sold ............................ 47,500*
Inventory .................................... 47,500
*$865,000 – $817,500
12/31/26l Cost of Goods Sold ............................ 37,500**
Inventory .................................... 37,500
**$1,025,000 – $987,500
8-2 Copyright © 2022 John Wiley & Sons, Inc. Kieso, Intermediate Accounting, 18/e, Exercise B Solutions (For Instructor Use Only)
,E 8.4B (Continued)
(b) 12/31/25
Inventory Loss.................................. 47,500
Inventory
.................................................. 47,500
12/31/26 Inventory Loss.....................................
37,500*
Inventory .....................................
37,500
(c) Both methods of recording LCNRV adjustments have the same effect
on net income.
Copyright © 2022 John Wiley & Sons, Inc. Kieso, Intermediate Accounting, 18/e, Exercise B Solutions (For Instructor Use Only) 8-3
, E 8.5B (15-20 minutes)
Net realizable value (ceiling) $56 – $18 = $38*
Net realizable value less normal profit (floor) $38* – $4 = $34
Replacement cost $40
Designated market $38* Ceiling
Cost (Incorrect valuation) $48**
LCNRV $38*
$48** figure used – $38 correct value per unit = $10 per unit.
$10 X 5,000 units = $50,000.
If ending inventory is overstated, net income will be overstated.
If beginning inventory is overstated, net income will be understated.
Therefore, net income for 2025 was overstated by $50,000 and net income for
2026 was understated by $50,000. The impact will net out to zero after the two
years, but each year will be misstated.
8-4 Copyright © 2022 John Wiley & Sons, Inc. Kieso, Intermediate Accounting, 18/e, Exercise B Solutions (For Instructor Use Only)