UNIT 3 — MILESTONE 3
16/18
16/18 that's 89% RETAKE
16 questions were answered correctly.
2 questions were answered incorrectly.
1
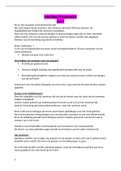
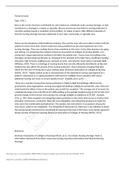
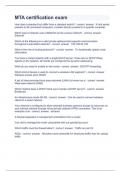
Abby can buy individual songs for $1.00 to download, or she can
download an entire album for $8.00. Abby can spend no more
than a total of $50. She wants to buy at least two albums, and no
more than 30 individual songs.
The following system of inequalities represents this situation,
where x is the number of individual songs and y is the number of
albums.
x + 8y ≤ 50
x ≤ 30
y≥2
Which blue shaded region corresponds to Abby’s possible
choices?
, UNIT 3 — MILESTONE 3
16/18
, UNIT 3 — MILESTONE 3
16/18
RATIONALE
The given situation can be
expressed with these
inequalities. To find the area that
represents the solution, we will
need to graph each inequality.
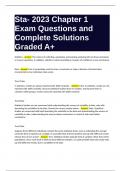
Let's start with x + 8y ≤ 50. To
graph this inequality, we need to
graph it as a line. We can do this
by finding the x and y intercepts.
The x intercept is the coordinate
point when y = 0. When
substituting this value in for y,
we get an x intercept of (50,0).
The y intercept is the coordinate
point when x = 0. When
substituting this value in for x,
we get a y intercept of (0,6.25).
Next, plot these two points and
graph the line.
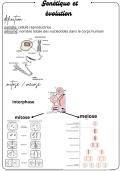
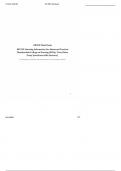
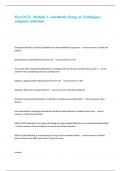
, This is the graph of the line that
UNIT 3 — MILESTONEcontains
3 the points (0,6.25) and
(50,0). Next, we need to graph
this as an inequality. Since Abby
wants to spend only up to 16/18
50 dollars, we will shade
everything BELOW the line.
This represents the inequality x
+ 8y ≤ 50. Now, we can graph
the other two inequalities, x ≤ 30
and y ≥ 2.
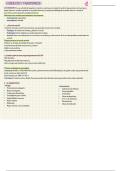
For the inequality x ≤ 30, this
tells us that Abby wants to buy
no more than 30 individual
songs. This is represented with
a line at x = 30 and we will
shade BELOW, or to the LEFT, of
the line.
For the inequality y ≥ 2, this tells
us that Abby wants to buy at
least 2 albums. This is
represented with a line at y = 2
and we will shade ABOVE the
line.
16/18
16/18 that's 89% RETAKE
16 questions were answered correctly.
2 questions were answered incorrectly.
1
Abby can buy individual songs for $1.00 to download, or she can
download an entire album for $8.00. Abby can spend no more
than a total of $50. She wants to buy at least two albums, and no
more than 30 individual songs.
The following system of inequalities represents this situation,
where x is the number of individual songs and y is the number of
albums.
x + 8y ≤ 50
x ≤ 30
y≥2
Which blue shaded region corresponds to Abby’s possible
choices?
, UNIT 3 — MILESTONE 3
16/18
, UNIT 3 — MILESTONE 3
16/18
RATIONALE
The given situation can be
expressed with these
inequalities. To find the area that
represents the solution, we will
need to graph each inequality.
Let's start with x + 8y ≤ 50. To
graph this inequality, we need to
graph it as a line. We can do this
by finding the x and y intercepts.
The x intercept is the coordinate
point when y = 0. When
substituting this value in for y,
we get an x intercept of (50,0).
The y intercept is the coordinate
point when x = 0. When
substituting this value in for x,
we get a y intercept of (0,6.25).
Next, plot these two points and
graph the line.
, This is the graph of the line that
UNIT 3 — MILESTONEcontains
3 the points (0,6.25) and
(50,0). Next, we need to graph
this as an inequality. Since Abby
wants to spend only up to 16/18
50 dollars, we will shade
everything BELOW the line.
This represents the inequality x
+ 8y ≤ 50. Now, we can graph
the other two inequalities, x ≤ 30
and y ≥ 2.
For the inequality x ≤ 30, this
tells us that Abby wants to buy
no more than 30 individual
songs. This is represented with
a line at x = 30 and we will
shade BELOW, or to the LEFT, of
the line.
For the inequality y ≥ 2, this tells
us that Abby wants to buy at
least 2 albums. This is
represented with a line at y = 2
and we will shade ABOVE the
line.