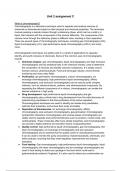
Unit 2 assignment C
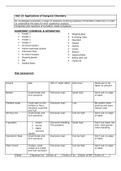
What is chromatography?
Chromatography is a laboratory technique used to separate and analyse mixtures of
chemicals or biomolecules based on their physical and chemical properties. The technique
involves passing a sample mixture through a stationary phase, which can be a solid or a
liquid, that interacts with the components of the mixture differently. The components of the
mixture move through the stationary phase at different rates, resulting in their separation.
There are several types of chromatography techniques, including gas chromatography (GC),
liquid chromatography (LC), high-performance liquid chromatography (HPLC) and many
more.
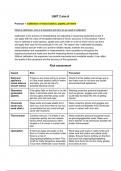
Chromatographic techniques are widely used in a variety of applications to separate ,
identify, and purify mixtures of chemicals. Some of the common uses of chromatography
include:
● Chemical analysis: gas chromatography, liquid chromatography and high exclusion
chromatography are key analytical tools in the chemical industry, used to determine
the composition of mixtures and identify unknown substances. It is widely used in
forensic science, pharmaceuticals. Food and beverage industry, environmental
monitoring and many other fields
● Purification: gel permeation chromatography, column chromatography, ion
exchange chromatography, high performance liquid chromatography, affinity
chromatography, size exclusion chromatography can be used to purify complex
mixtures, such as natural products, proteins, and pharmaceutical compounds. By
separating the different components of a mixture, chromatography can isolate the
desired substance in high purity
● Drug development: high performance liquid chromatography and gas
chromatography play a critical role in drug development from the initial discovery of
potential drug candidates to the final purification of the active ingredient.
Chromatographic techniques are used to identify and isolate drug candidates,
optimise their properties, and ensure their purity and safety
● Separation of biomolecules: ion exchange chromatography, affinity
chromatography, size exclusion chromatography, gel-permeation chromatography,
hydrophobic interaction chromatography and reverse-phase chromatography are
widely used to separate and purify biomolecules such as proteins, nucleic acids, and
carbohydrates. These molecules often have similar properties, and chromatography
can provide a highly selective and sensitive means of separating them
● Quality control: high performance liquid chromatography, gas chromatography, thin
layer chromatography, ion exchange chromatography and size exclusion
chromatography are an essential tool for quality control in manufacturing processes.
It can be used to monitor the purity and potency of pharmaceuticals, chemicals, and
other products, ensuring that they meet regulatory requirements and industry
standards.
● Food testing: Gas chromatography, high performance liquid chromatography, liquid
chromatography, thin layer chromatography and ion exchange chromatography are
used in food testing to detect any spoilage in the food which could lead to
gastrointestinal problems if ingested. It is also used to detect any contamination as
, there might be harmful pollutants present in the food. It is also used to detect any
food additives present in the food sample so that the consumer and the producer
know what nutrition is available in the food.
Analysis
Plant Paper Chromatography
I was able to identify 4 pigments for my paper chromatography. The first colour I identified
was chlorophyll-b and it had an Rf value of 0.26 the real data had an Rf value of 0.54 so i
was very off by 0.28, the second colour i identified was chlorophyll-a and its Rf value i
calculated was 0.37 whereas the real data’s Rf value was 0.68 this makes a huge difference
of 0.31. The third colour I was able to identify was fucoxanthin which is one of the
xanthophylls, I had an Rf value of 0.59 and I knew it was fucoxanthin because the real data
had an Rf value of 0.51 and i was only off by 0.08, but since the Rf value of chlorophyll-a is
also 0.54 it couldn’t have been chlorophyll-a because the colour travelled further than the
colour travelled from chlorophyll-a. The last colour I identified was B-carotene and I had an
Rf value of 1.00 and the Rf value of the real data was 0.94 which was close and the
difference was only 0.06 it was also the furthest and the last colour spot so I decided that it
was B-carotene.
Plant Thin Layer Chromatography
I was able to identify 6 pigments in this TLC, the first pigment was neoxanthin which I had an
Rf value of 0.26 the real data had an Rf value of 0.22 my calculated value is really close to
the real value and is only off by 0.04, the second pigment was lutein which I calculated to
have an Rf value of 0.41 the real data was 0.43 and the comparison is even closer than
neoxanthin as i was only off my 0.02, the third pigment was fucoxanthin which had an Rf
value of 0.59 the real data had an Rf value of 0.51 which is also falling in the range of
fucoxanthin, the fourth pigment was chlorophyll-b which had an Rf value of 0.68 but the real
data’s Rf value was 0.54 so i was off by 0.14 which is the largest difference out of all my
pigments, the fifth pigment was chlorophyll-a which had an Rf value of 0.73 the real data had
an Rf value of 0.68 these values were also very close and had a difference of 0.05, and the
sixth pigment was B-carotene which had an Rf value of 1.00 the real data’s Rf value was
0.94 and again i was off by 0.06. I was very happy with my results and the data produced
What is chromatography?
Chromatography is a laboratory technique used to separate and analyse mixtures of
chemicals or biomolecules based on their physical and chemical properties. The technique
involves passing a sample mixture through a stationary phase, which can be a solid or a
liquid, that interacts with the components of the mixture differently. The components of the
mixture move through the stationary phase at different rates, resulting in their separation.
There are several types of chromatography techniques, including gas chromatography (GC),
liquid chromatography (LC), high-performance liquid chromatography (HPLC) and many
more.
Chromatographic techniques are widely used in a variety of applications to separate ,
identify, and purify mixtures of chemicals. Some of the common uses of chromatography
include:
● Chemical analysis: gas chromatography, liquid chromatography and high exclusion
chromatography are key analytical tools in the chemical industry, used to determine
the composition of mixtures and identify unknown substances. It is widely used in
forensic science, pharmaceuticals. Food and beverage industry, environmental
monitoring and many other fields
● Purification: gel permeation chromatography, column chromatography, ion
exchange chromatography, high performance liquid chromatography, affinity
chromatography, size exclusion chromatography can be used to purify complex
mixtures, such as natural products, proteins, and pharmaceutical compounds. By
separating the different components of a mixture, chromatography can isolate the
desired substance in high purity
● Drug development: high performance liquid chromatography and gas
chromatography play a critical role in drug development from the initial discovery of
potential drug candidates to the final purification of the active ingredient.
Chromatographic techniques are used to identify and isolate drug candidates,
optimise their properties, and ensure their purity and safety
● Separation of biomolecules: ion exchange chromatography, affinity
chromatography, size exclusion chromatography, gel-permeation chromatography,
hydrophobic interaction chromatography and reverse-phase chromatography are
widely used to separate and purify biomolecules such as proteins, nucleic acids, and
carbohydrates. These molecules often have similar properties, and chromatography
can provide a highly selective and sensitive means of separating them
● Quality control: high performance liquid chromatography, gas chromatography, thin
layer chromatography, ion exchange chromatography and size exclusion
chromatography are an essential tool for quality control in manufacturing processes.
It can be used to monitor the purity and potency of pharmaceuticals, chemicals, and
other products, ensuring that they meet regulatory requirements and industry
standards.
● Food testing: Gas chromatography, high performance liquid chromatography, liquid
chromatography, thin layer chromatography and ion exchange chromatography are
used in food testing to detect any spoilage in the food which could lead to
gastrointestinal problems if ingested. It is also used to detect any contamination as
, there might be harmful pollutants present in the food. It is also used to detect any
food additives present in the food sample so that the consumer and the producer
know what nutrition is available in the food.
Analysis
Plant Paper Chromatography
I was able to identify 4 pigments for my paper chromatography. The first colour I identified
was chlorophyll-b and it had an Rf value of 0.26 the real data had an Rf value of 0.54 so i
was very off by 0.28, the second colour i identified was chlorophyll-a and its Rf value i
calculated was 0.37 whereas the real data’s Rf value was 0.68 this makes a huge difference
of 0.31. The third colour I was able to identify was fucoxanthin which is one of the
xanthophylls, I had an Rf value of 0.59 and I knew it was fucoxanthin because the real data
had an Rf value of 0.51 and i was only off by 0.08, but since the Rf value of chlorophyll-a is
also 0.54 it couldn’t have been chlorophyll-a because the colour travelled further than the
colour travelled from chlorophyll-a. The last colour I identified was B-carotene and I had an
Rf value of 1.00 and the Rf value of the real data was 0.94 which was close and the
difference was only 0.06 it was also the furthest and the last colour spot so I decided that it
was B-carotene.
Plant Thin Layer Chromatography
I was able to identify 6 pigments in this TLC, the first pigment was neoxanthin which I had an
Rf value of 0.26 the real data had an Rf value of 0.22 my calculated value is really close to
the real value and is only off by 0.04, the second pigment was lutein which I calculated to
have an Rf value of 0.41 the real data was 0.43 and the comparison is even closer than
neoxanthin as i was only off my 0.02, the third pigment was fucoxanthin which had an Rf
value of 0.59 the real data had an Rf value of 0.51 which is also falling in the range of
fucoxanthin, the fourth pigment was chlorophyll-b which had an Rf value of 0.68 but the real
data’s Rf value was 0.54 so i was off by 0.14 which is the largest difference out of all my
pigments, the fifth pigment was chlorophyll-a which had an Rf value of 0.73 the real data had
an Rf value of 0.68 these values were also very close and had a difference of 0.05, and the
sixth pigment was B-carotene which had an Rf value of 1.00 the real data’s Rf value was
0.94 and again i was off by 0.06. I was very happy with my results and the data produced