Advanced Research Methods part B – Application Lecture Regression Analysis
PPT 1
Research question
Does competition affect the firm’s market share if controlled for industry and price sensitivity?
The conceptual model reveals 5 hypotheses.
Univariate analysis
- Kijk of de missing values van iedere variable lager is dan 10%
- Mean
- Median = de middelste waarde in de reeks
- Mode = welke waarde komt het vaakst voor
Centering the variable ‘scope’
Mean 0 representeert nu de gemiddelde waarde van de variabele.
Interactie parameter
Scope x number of competitors
Why centering
- Reduction of the overlap between ScopeCom (main effect) and interaction effect
o Reduction of multicollinearity effect
- It changes the test & interpretation of lower order effects; no main (overall) effects but
so-called conditional (simple) effects, e.g. NrComp is measured at ScopeCom being 0
(mean if mean center; or any other particular value)
- Centering provides a (more) meaningful reference-point for the lower order effect(s)
given a higher order (i.e. an interaction) effect in the model
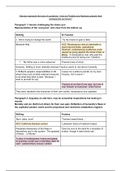
Model building – 4 components
De controle-variabelen industry en price-sensitivity worden als eerst in het model
toegevoegd. Vervolgens worden de main-effects toegevoegd. Vervolgens wordt de interactie-
parameter toegevoegd.
ANOVA en model 3 testen
1
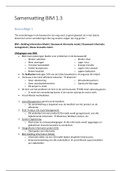
, Regression coefficients per component added
Model 1: 29,352 is het gemiddelde van de food-industry. Het gemiddelde van clothing is
5,416 lager dan 29,352.
Residual analysis
Het ligt dicht bij de horizontaal, dat is goed.
Homoscedasticity, constant error variance for each value of dependent variable.
De waarden van de outliers zijn allemaal kleiner dan 4.
2
PPT 1
Research question
Does competition affect the firm’s market share if controlled for industry and price sensitivity?
The conceptual model reveals 5 hypotheses.
Univariate analysis
- Kijk of de missing values van iedere variable lager is dan 10%
- Mean
- Median = de middelste waarde in de reeks
- Mode = welke waarde komt het vaakst voor
Centering the variable ‘scope’
Mean 0 representeert nu de gemiddelde waarde van de variabele.
Interactie parameter
Scope x number of competitors
Why centering
- Reduction of the overlap between ScopeCom (main effect) and interaction effect
o Reduction of multicollinearity effect
- It changes the test & interpretation of lower order effects; no main (overall) effects but
so-called conditional (simple) effects, e.g. NrComp is measured at ScopeCom being 0
(mean if mean center; or any other particular value)
- Centering provides a (more) meaningful reference-point for the lower order effect(s)
given a higher order (i.e. an interaction) effect in the model
Model building – 4 components
De controle-variabelen industry en price-sensitivity worden als eerst in het model
toegevoegd. Vervolgens worden de main-effects toegevoegd. Vervolgens wordt de interactie-
parameter toegevoegd.
ANOVA en model 3 testen
1
, Regression coefficients per component added
Model 1: 29,352 is het gemiddelde van de food-industry. Het gemiddelde van clothing is
5,416 lager dan 29,352.
Residual analysis
Het ligt dicht bij de horizontaal, dat is goed.
Homoscedasticity, constant error variance for each value of dependent variable.
De waarden van de outliers zijn allemaal kleiner dan 4.
2