MOTION GRAPHS 10
IGCSE MATHEMATICS
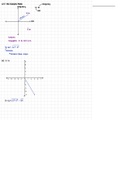
1 A cyclist is training for a competition and the graph shows one part of the training.
20
Speed
(m/s) 10
0 10 20 30 40 50
Time (seconds)
(a) Calculate the acceleration during the first 10 seconds.
Answer(a) m/s2 [2]
(b) Calculate the distance travelled in the first 30 seconds.
Answer(b) m [2]
(c) Calculate the average speed for the entire 45 seconds.
Answer(c) m/s [3]
Ó UCLES 2004 0580/2, 0581/2 Jun/04/Q21
MOTION GRAPHS IGCSE EXTENDED MATHEMATICS - 0580 Page 1 .
,MOTION GRAPHS 10
IGCSE MATHEMATICS
2
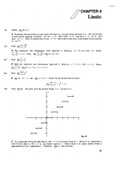
18
16
14
12
10
Speed
(m / s)
8
6
4
2
0 10 20 30 40 50 60 70 80 90 100
Time (s)
The diagram shows part of a journey by a truck.
(a) The truck accelerates from rest to 18 m/s in 30 seconds.
Calculate the acceleration of the truck.
Answer(a) m/s2 [1]
(b) The truck then slows down in 10 seconds for some road works and travels through the road
works at 12 m/s.
At the end of the road works it accelerates back to a speed of 18 m/s in 10 seconds.
Find the total distance travelled by the truck in the 100 seconds.
Answer(b) m [3]
© UCLES 2007 0580/02/J/07/Q21
MOTION GRAPHS IGCSE EXTENDED MATHEMATICS - 0580 Page 2 .
, MOTION GRAPHS 9
IGCSE MATHEMATICS
3 The graphs show the speeds of two cyclists, Alonso and Boris.
Alonso accelerated to 10 m/s, travelled at a steady speed and then slowed to a stop.
10
Speed
Alonso
(m / s)
0 2 4 6 8 10 12 14 16
Time (seconds)
Boris accelerated to his maximum speed, v m/s, and then slowed to a stop.
v NOT TO
SCALE
Speed
(m / s)
Boris
0
Time (seconds) 16
Both cyclists travelled the same distance in the 16 seconds.
Calculate the maximum speed for Boris.
Show all your working.
Answer m/s [5]
© UCLES 2010 0580/22/M/J/10/Q16 [Turn over
MOTION GRAPHS IGCSE EXTENDED MATHEMATICS - 0580 Page 3 .
IGCSE MATHEMATICS
1 A cyclist is training for a competition and the graph shows one part of the training.
20
Speed
(m/s) 10
0 10 20 30 40 50
Time (seconds)
(a) Calculate the acceleration during the first 10 seconds.
Answer(a) m/s2 [2]
(b) Calculate the distance travelled in the first 30 seconds.
Answer(b) m [2]
(c) Calculate the average speed for the entire 45 seconds.
Answer(c) m/s [3]
Ó UCLES 2004 0580/2, 0581/2 Jun/04/Q21
MOTION GRAPHS IGCSE EXTENDED MATHEMATICS - 0580 Page 1 .
,MOTION GRAPHS 10
IGCSE MATHEMATICS
2
18
16
14
12
10
Speed
(m / s)
8
6
4
2
0 10 20 30 40 50 60 70 80 90 100
Time (s)
The diagram shows part of a journey by a truck.
(a) The truck accelerates from rest to 18 m/s in 30 seconds.
Calculate the acceleration of the truck.
Answer(a) m/s2 [1]
(b) The truck then slows down in 10 seconds for some road works and travels through the road
works at 12 m/s.
At the end of the road works it accelerates back to a speed of 18 m/s in 10 seconds.
Find the total distance travelled by the truck in the 100 seconds.
Answer(b) m [3]
© UCLES 2007 0580/02/J/07/Q21
MOTION GRAPHS IGCSE EXTENDED MATHEMATICS - 0580 Page 2 .
, MOTION GRAPHS 9
IGCSE MATHEMATICS
3 The graphs show the speeds of two cyclists, Alonso and Boris.
Alonso accelerated to 10 m/s, travelled at a steady speed and then slowed to a stop.
10
Speed
Alonso
(m / s)
0 2 4 6 8 10 12 14 16
Time (seconds)
Boris accelerated to his maximum speed, v m/s, and then slowed to a stop.
v NOT TO
SCALE
Speed
(m / s)
Boris
0
Time (seconds) 16
Both cyclists travelled the same distance in the 16 seconds.
Calculate the maximum speed for Boris.
Show all your working.
Answer m/s [5]
© UCLES 2010 0580/22/M/J/10/Q16 [Turn over
MOTION GRAPHS IGCSE EXTENDED MATHEMATICS - 0580 Page 3 .