1
Graphing Functions- HW Problems
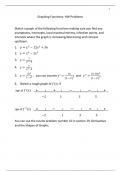
Sketch a graph of the following functions making sure you find any
asymptotes, intercepts, local maxima/minima, infection points, and
intervals where the graph is increasing/decreasing and concave
up/down.
1. 𝑦 = 𝑥 3 − 12𝑥 2 + 36
2. 𝑦 = 𝑥 4 − 2𝑥 2
1
3. 𝑦 =
𝑥2 −4
𝑥
4. 𝑦 =
𝑥2 −4
3𝑥2 ′ 6𝑥 ′′ 6+18𝑥2
5. 𝑦 = , you can assume 𝑦 = 2 and 𝑦 = 3 .
1−𝑥2 (1−𝑥2 ) (1−𝑥2 )
6. Sketch a rough graph of 𝑓(𝑥) if
sign of 𝑓 ′ (𝑥) __+_____|_____+____|_____−_____|_____−____|____+__
−2 1 3 5
sign of 𝑓 ′ ′(𝑥) __+_____|____−_____|_____−_____|_____+____|____+__
−2 1 3 5
You can use the results problem number 10 in section 19, Derivatives
and the Shapes of Graphs.
Graphing Functions- HW Problems
Sketch a graph of the following functions making sure you find any
asymptotes, intercepts, local maxima/minima, infection points, and
intervals where the graph is increasing/decreasing and concave
up/down.
1. 𝑦 = 𝑥 3 − 12𝑥 2 + 36
2. 𝑦 = 𝑥 4 − 2𝑥 2
1
3. 𝑦 =
𝑥2 −4
𝑥
4. 𝑦 =
𝑥2 −4
3𝑥2 ′ 6𝑥 ′′ 6+18𝑥2
5. 𝑦 = , you can assume 𝑦 = 2 and 𝑦 = 3 .
1−𝑥2 (1−𝑥2 ) (1−𝑥2 )
6. Sketch a rough graph of 𝑓(𝑥) if
sign of 𝑓 ′ (𝑥) __+_____|_____+____|_____−_____|_____−____|____+__
−2 1 3 5
sign of 𝑓 ′ ′(𝑥) __+_____|____−_____|_____−_____|_____+____|____+__
−2 1 3 5
You can use the results problem number 10 in section 19, Derivatives
and the Shapes of Graphs.