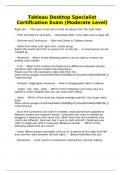
Tableau Desktop Specialist
Certification Exam (Moderate Level)
Right Join - -This type of join will include all values from the right table
- Filter the data for all sheets - -Using data filter in the data source page will
- Discrete and Continuous - -Blue and Green in Tableau means
- Select the marks and right click, create group
Select the marks and click on group icon on the top - -A visual group can be
created by
- Reversed - -Which of the following options can be used to reverse the
palette color shades
- 0.35 - -What is the median Life Expectancy difference between top two
countries with highest median Life Expectancy.
Please use the Life expectancy data sets from link -
https://drive.google.com/drive/folders/193Q8EyvYyrXusdS5r5ARyisK8DY0k_jt
?usp=sharing
- Analysis - Aggregate measures - -How to disaggregate data in tableau
- .hyper, .tde, .tdsx, .twbx - -Which of the following is an local copy of a
subset or entire dataset that you can share with others.
- Idaho - -Which of the state has lowest average quantity. Use Super store
data -
https://drive.google.com/drive/folders/193Q8EyvYyrXusdS5r5ARyisK8DY0k_jt
?usp=sharing
- Once the Combined axis chart is created, rows/columns are updated to
Measure names and measure values. Combined axis chart is created by
dragging 2 measures onto same axis. (Both Dual axis and combined axis
charts are different. Dual axis has 2 axis on right and left. Combined axis
chart is single axis with 2 measures (Measure values). - -Which of the
following statements are correct
- Union (Blend always resembles Left join as it selects all the data from left
and common data between left and right.) - -Blend resembles this join
- Dimension - -A bar chart is converted to stacked bar chart by adding
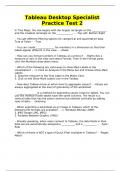