SPSS SUMMARY
SPSS General Tasks
• Variable names must be unique, begin with a letter and cannot include full stops, blanks or
other characteristics.
• If your variable has decimal places, change this to suit your needs.
• Label column allows you to provide a longer description for your variable which will be used in
the output.
• Values column allows you define the meaning of the values you have used to code your
variables.
• SPSS will recognize any blank cell as missing data. Sometimes researchers assign specific values
to indicate missing values for their data.
• Measure column refers to the level of measurement of each of your variables. The default is
Scale (interval/ratio level of measurement). Choose Nominal for categorical data, Ordinal if your
data involve rankings.
Lecture 2: Basic Data Analytics
• Screen dataset: Investigate quality of data
o Errors, missing values, inconsistencies
• Explore and analyze the data:
o Describe and summarize data: A complete run-down analysis of all the variables in
your dataset one-at-a-time (univariate statistics)
o Inferential analysis: Learning about “the world” (univariate statistics)
o Differential analysis (bivariate statistics)
o Associative analysis (bivariate statistics)
Taste Evaluations of Beer Brands - Findings Allison & Uhl (1964)
• Beer drinkers could not distinguish taste differences among beers from unlabeled bottles
• Brand label increases evaluation of beer: increase differs per brand
Dataset: Taste evaluations (Beer.sav)
• Gender (female/male)
• Age (open ended question)
• Household Size (open ended question)
• Region (A’dam, R’dam, Utrecht/West/North/East/South)
• Social Class (A/BB/BO/C, D)
• Unbranded evaluation of beer A & B (10-point scale, 1 = poor; 10 = excellent)
• Branded evaluation of beer A & B (10-point scale, 1 = poor; 10 = excellent)
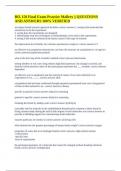
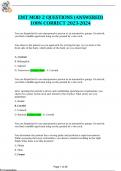
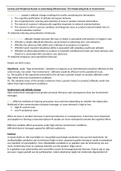
Switch between Data View (shows all data) and Variable View (shows
details of the variables/columns)
Data File >Variable View*
1
, Variable View
Define Name (no space etc.)
Shown in case of e.g. !Always define
Numbers of decimal
reverse coding. measurement
places shown Could define
level!
Further Description missing values
1. Screening the data set
1.1. Check for missing data
• In long surveys, participants accidentally or deliberately miss out questions
• Responses other than original scale (e.g., ‘don’t know’, ‘not applicable’ )
• Survey flow logic
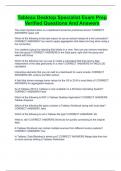
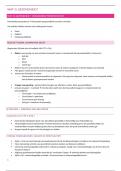
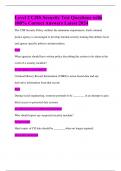
Example:
Any response other than the original scale (e.g. 1-5) should be coded as missing in “missing” column
in the variable view.
2
, The “missing” values will be shown as dots
in the dataset.
Dealing with missing data
▪ Is the missing data ignorable?
- If they are part of the research design, YES. Otherwise, NO and you have the
following options:
▪ Assign missing values:
- Calculating replacement values (e.g., mean/mode substitution)
- Delete missing values:
Options button in the SPSS statistical procedures offers you choices
- Exclude cases listwise: If a person has a missing value for any variable, then they are
excluded from the whole analysis.
- Exclude cases pairwise: A person’s data is excluded only for analyses for which she
has missing data.
1.2. Find ´strange codes´ and errors (visual if manageable)
Consistency checks (out of range, logically inconsistent, extreme values)
In most cases no out of range, illogically inconsistent, extreme values (check especially open ended
questions – age and household size)
1.3. Screening data with SPSS via analyzing frequencies, and plots (scatterplot, boxplot)
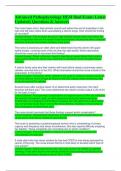
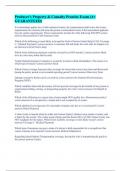
1.4. Reverse coding (e.g. reversing negatively worded items)
• Social Class (A/BB/BO/C, D): coded from highest to lowest 1=A (highest), 2=BB, 3=BO, 4=C or D
(lowest)
• Reverse coding can be easily done in SPSS:
Transform > Recode > Into Different Variable> pull variable in variable box > Old and New Values
> define old and new value > add > Continue > Define Output Variable Name and Label > OK (alte
Variable evtl. Löschen)
3
SPSS General Tasks
• Variable names must be unique, begin with a letter and cannot include full stops, blanks or
other characteristics.
• If your variable has decimal places, change this to suit your needs.
• Label column allows you to provide a longer description for your variable which will be used in
the output.
• Values column allows you define the meaning of the values you have used to code your
variables.
• SPSS will recognize any blank cell as missing data. Sometimes researchers assign specific values
to indicate missing values for their data.
• Measure column refers to the level of measurement of each of your variables. The default is
Scale (interval/ratio level of measurement). Choose Nominal for categorical data, Ordinal if your
data involve rankings.
Lecture 2: Basic Data Analytics
• Screen dataset: Investigate quality of data
o Errors, missing values, inconsistencies
• Explore and analyze the data:
o Describe and summarize data: A complete run-down analysis of all the variables in
your dataset one-at-a-time (univariate statistics)
o Inferential analysis: Learning about “the world” (univariate statistics)
o Differential analysis (bivariate statistics)
o Associative analysis (bivariate statistics)
Taste Evaluations of Beer Brands - Findings Allison & Uhl (1964)
• Beer drinkers could not distinguish taste differences among beers from unlabeled bottles
• Brand label increases evaluation of beer: increase differs per brand
Dataset: Taste evaluations (Beer.sav)
• Gender (female/male)
• Age (open ended question)
• Household Size (open ended question)
• Region (A’dam, R’dam, Utrecht/West/North/East/South)
• Social Class (A/BB/BO/C, D)
• Unbranded evaluation of beer A & B (10-point scale, 1 = poor; 10 = excellent)
• Branded evaluation of beer A & B (10-point scale, 1 = poor; 10 = excellent)
Switch between Data View (shows all data) and Variable View (shows
details of the variables/columns)
Data File >Variable View*
1
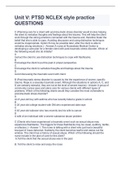
, Variable View
Define Name (no space etc.)
Shown in case of e.g. !Always define
Numbers of decimal
reverse coding. measurement
places shown Could define
level!
Further Description missing values
1. Screening the data set
1.1. Check for missing data
• In long surveys, participants accidentally or deliberately miss out questions
• Responses other than original scale (e.g., ‘don’t know’, ‘not applicable’ )
• Survey flow logic
Example:
Any response other than the original scale (e.g. 1-5) should be coded as missing in “missing” column
in the variable view.
2
, The “missing” values will be shown as dots
in the dataset.
Dealing with missing data
▪ Is the missing data ignorable?
- If they are part of the research design, YES. Otherwise, NO and you have the
following options:
▪ Assign missing values:
- Calculating replacement values (e.g., mean/mode substitution)
- Delete missing values:
Options button in the SPSS statistical procedures offers you choices
- Exclude cases listwise: If a person has a missing value for any variable, then they are
excluded from the whole analysis.
- Exclude cases pairwise: A person’s data is excluded only for analyses for which she
has missing data.
1.2. Find ´strange codes´ and errors (visual if manageable)
Consistency checks (out of range, logically inconsistent, extreme values)
In most cases no out of range, illogically inconsistent, extreme values (check especially open ended
questions – age and household size)
1.3. Screening data with SPSS via analyzing frequencies, and plots (scatterplot, boxplot)
1.4. Reverse coding (e.g. reversing negatively worded items)
• Social Class (A/BB/BO/C, D): coded from highest to lowest 1=A (highest), 2=BB, 3=BO, 4=C or D
(lowest)
• Reverse coding can be easily done in SPSS:
Transform > Recode > Into Different Variable> pull variable in variable box > Old and New Values
> define old and new value > add > Continue > Define Output Variable Name and Label > OK (alte
Variable evtl. Löschen)
3