Lecture 1: Introduction
workstation GIS
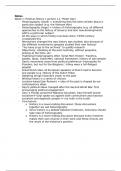
The aim of GIS is not just to
create a database of digital
representation of geographic
phenomena, but to provide
means of selecting, retrieving
and analysing them.
ESRI products:
- ArcGIS Pro 3.x
- ArcGIS-online
- Apps
GIS translates real world into layers. Every layer contains a single theme. For example, roads and soil
layers get separate layers. Many choices to be made. Stored in point, lines and polygons (vector) or
raster structures.
- Vector: point, lines and polygons
- Raster
- Lattice: vector of raster image
- Tin: Triangular Irregular Networks = vector
visualization of continuous surfaces.
- Image
- Table
- Voxel: 3D pixel
- Point cloud: dataset created with laser
scanners or photogrammetry.
Vector: points and vertices are connected by arcs (lines) and then connected as polygons.
Raster: in a raster you have cells, define a coordinate system and in the cells store a value. There are
two types of values: whole numbers and decimals. Whole numbers often describe classes that are
connected to an attribute table (e.g. water, soil etc). If you want variation, you can use floating
numbers.
If tabular data contains an coordinate or address, datasets can be linked.
Data is stored in a geodatabase.
Ways to store vector files:
- .shp: shape file. Is a set of files keep them together
- .dbx
- .prj
- .shx
Projection the Netherlands: stereographic projection. Ellipsoid of Bessel. Amersfoort is centre. False
easting 155000, false northing 463000.
, Practical 1: Digitizing maps
Digitizing maps:
1. Define coordinate system and projection: rijksdriekhoekstelsel grids: rd_new for Netherlands
2. Add the map with pyramids and zoom to layer
3. Add Ground Control Points (GCP) with the coordinate system of the map
a. Imagergy -> georeferenced -> add control point -> add the right coordinates for at
least for points in the control point data
b. Look at quality -> RMS error (units meter), explains offset = Root-mean square. We
have positive and negative offset, so we square them, then average and then root. In
this case: 1 cm = 500 m, so 1 mm = 15 m, so 3/10 mm.
c. Save control points
4. Create new feature class in database. Create -> outline -> modify -> edit vertices. Make arcs
as border of polygons, not connecting but crossing. Save!
5. Feature to polygon: overshoot is gone and automatically creates attribute table. Look at
statistics sum: should be a whole number.
6. Add column of soil types in attribute table
a. Short/long: whole numbers
b. Double: decimals
c. Blob: whatever you like
Pros Cons
- Calculations with maps - Time consuming
- Reproduce and reuse of data - Data management
- Process large amounts of data uniformly - Preservability of data
- Version problems
- Costs
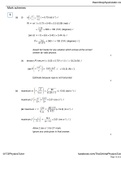
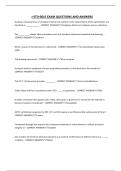
ArcGIS
Scanning
settings
Create
Register
featureclas
Rectify Draw Arcs
Error
correction Create
Polygons
workstation GIS
The aim of GIS is not just to
create a database of digital
representation of geographic
phenomena, but to provide
means of selecting, retrieving
and analysing them.
ESRI products:
- ArcGIS Pro 3.x
- ArcGIS-online
- Apps
GIS translates real world into layers. Every layer contains a single theme. For example, roads and soil
layers get separate layers. Many choices to be made. Stored in point, lines and polygons (vector) or
raster structures.
- Vector: point, lines and polygons
- Raster
- Lattice: vector of raster image
- Tin: Triangular Irregular Networks = vector
visualization of continuous surfaces.
- Image
- Table
- Voxel: 3D pixel
- Point cloud: dataset created with laser
scanners or photogrammetry.
Vector: points and vertices are connected by arcs (lines) and then connected as polygons.
Raster: in a raster you have cells, define a coordinate system and in the cells store a value. There are
two types of values: whole numbers and decimals. Whole numbers often describe classes that are
connected to an attribute table (e.g. water, soil etc). If you want variation, you can use floating
numbers.
If tabular data contains an coordinate or address, datasets can be linked.
Data is stored in a geodatabase.
Ways to store vector files:
- .shp: shape file. Is a set of files keep them together
- .dbx
- .prj
- .shx
Projection the Netherlands: stereographic projection. Ellipsoid of Bessel. Amersfoort is centre. False
easting 155000, false northing 463000.
, Practical 1: Digitizing maps
Digitizing maps:
1. Define coordinate system and projection: rijksdriekhoekstelsel grids: rd_new for Netherlands
2. Add the map with pyramids and zoom to layer
3. Add Ground Control Points (GCP) with the coordinate system of the map
a. Imagergy -> georeferenced -> add control point -> add the right coordinates for at
least for points in the control point data
b. Look at quality -> RMS error (units meter), explains offset = Root-mean square. We
have positive and negative offset, so we square them, then average and then root. In
this case: 1 cm = 500 m, so 1 mm = 15 m, so 3/10 mm.
c. Save control points
4. Create new feature class in database. Create -> outline -> modify -> edit vertices. Make arcs
as border of polygons, not connecting but crossing. Save!
5. Feature to polygon: overshoot is gone and automatically creates attribute table. Look at
statistics sum: should be a whole number.
6. Add column of soil types in attribute table
a. Short/long: whole numbers
b. Double: decimals
c. Blob: whatever you like
Pros Cons
- Calculations with maps - Time consuming
- Reproduce and reuse of data - Data management
- Process large amounts of data uniformly - Preservability of data
- Version problems
- Costs
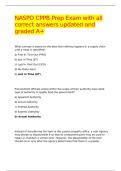
ArcGIS
Scanning
settings
Create
Register
featureclas
Rectify Draw Arcs
Error
correction Create
Polygons