MATH 110 All Exams STATISTICS- Portage
Learning 2024
Expected Questions and Answers
(Verified by Expert)
Mod 1 Exam 1
1. Define each of the following:
a) Observation
b) Element
c) Variable
Observation- all the information collected for each element in a study
Element- in a data set, the individual and unique entry about which data has
been collected, analyzed and presented in the same manner
Variable- a particular, measurable attribute that the researcher believes is
needed to describe the element in their study.
2. Explain outliers
An outlier is a value which is out of place compared to the other values. It
may be too large or too small compared to the other values
3. Look at the following data and see if you can
identify any outliers: 53 786 789 821 794 805
63 777 814 2333 783 811 795 788 780
Outliers: 53 63 2333
,4.
a) How many were burgers?
b) How many were fish?
a) Burgers, 2900(0.12)=348
b) Fish, 2900(0.28)=812
,Mod 2 Exam
1. During an hour at a fast food restaurant, the following
types of sandwiches are ordered: Turkey Turkey
Cheeseburger Hamburger Fish Chicken
Hamburger Cheeseburger Fish
HamburgerTurkey Fish Chicken
Chicken Fish Turkey Fish
HamburgerFish
Cheeseburger Fish Cheeseburger
Hamburger Fish Fish Cheeseburger
Hamburger Fish Turkey Turkey
Chicken Fish Chicken Cheeseburger
Fish Turkey Fish Fish Hamburger Fish
Fish Turkey Chicken Hamburger
Fish Cheeseburger Chicken Chicken
Turkey Fish Hamburger Chicken
Fish
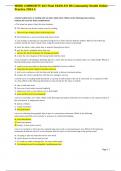
a) Make a frequency distribution for this data.
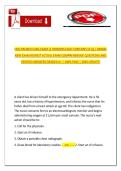
b) Makea relative frequency distribution for this data. Include relative
percentages on this table.
a.
, b.
Learning 2024
Expected Questions and Answers
(Verified by Expert)
Mod 1 Exam 1
1. Define each of the following:
a) Observation
b) Element
c) Variable
Observation- all the information collected for each element in a study
Element- in a data set, the individual and unique entry about which data has
been collected, analyzed and presented in the same manner
Variable- a particular, measurable attribute that the researcher believes is
needed to describe the element in their study.
2. Explain outliers
An outlier is a value which is out of place compared to the other values. It
may be too large or too small compared to the other values
3. Look at the following data and see if you can
identify any outliers: 53 786 789 821 794 805
63 777 814 2333 783 811 795 788 780
Outliers: 53 63 2333
,4.
a) How many were burgers?
b) How many were fish?
a) Burgers, 2900(0.12)=348
b) Fish, 2900(0.28)=812
,Mod 2 Exam
1. During an hour at a fast food restaurant, the following
types of sandwiches are ordered: Turkey Turkey
Cheeseburger Hamburger Fish Chicken
Hamburger Cheeseburger Fish
HamburgerTurkey Fish Chicken
Chicken Fish Turkey Fish
HamburgerFish
Cheeseburger Fish Cheeseburger
Hamburger Fish Fish Cheeseburger
Hamburger Fish Turkey Turkey
Chicken Fish Chicken Cheeseburger
Fish Turkey Fish Fish Hamburger Fish
Fish Turkey Chicken Hamburger
Fish Cheeseburger Chicken Chicken
Turkey Fish Hamburger Chicken
Fish
a) Make a frequency distribution for this data.
b) Makea relative frequency distribution for this data. Include relative
percentages on this table.
a.
, b.