Statistics Chapter 10 Exam Questions with Verified Solutions Latest Update 2024 Already Passed
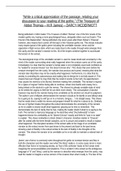
If we find that there is a linear correlation between the concentration of carbon dioxide in our
atmosphere and the global temperature, does that indicate that changes in the concentration of carbon
dioxide cause changes in the global temperature? - Answers No. The presence of a linear correlation
between two variables does not imply that one of the variables is the cause of the other variable.
For a sample of eight bears, researchers measured the distances around the bears' chests and weighed
the bears. Minitab was used to find that the value of the linear correlation coefficient is
r =0.996 Using α=0.05,
determine if there is a linear correlation between chest size and weight. What proportion of the
variation in weight can be explained by the linear relationship between weight and chest size?
Critical Values for the Coefficient
n a=0.05 a=0.01
4 0.950 0.990
5 0.878 0.959
6 0.811 0.917
7 0.754 0.875
8 0.707 0.834
9 0.666 0.798
10 0.632 0.765
11 0.602 0.735
12 0.576 0.708
13 0.553 0.684
14 0.532 0.661
15 0.514 0.641
16 0.497 0.623
17 0.482 0.606
, 18 0.468 0.590
19 0.456 0.575
20 0.444 0.561
25 0.396 0.505
30 0.361 0.463
35 0.335 0.430
40 0.312 0.402
45 0.294 0.378
50 0.279 0.361
60 0.254 0.330
70 0.236 0.305
80 0.220 0.286
90 0.207 0.269
100 0.196 0.256
NOTE: To test Ho:p=0, against H1:p# 0, reject - Answers A.)Yes, because the absolute value of the test
statistic exceeds the critical value of 0.707.
B.)What proportion of the variation in weight can be explained by the linear relationship between
weight and chest size?
0.996 squared = 0.992
Therefore, 99.2% of the variation in weight can be explained by the linear relationship between weight
and chest size.