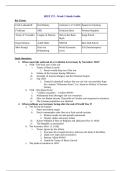
Lecture 1: Introduction
• CASES AND VARIABLES
Population: the set of all possible cases of interest
Univariate: one variable Sample: a set of cases that doesn’t include every member of the
(e.g. what is the average population
grade on the ISA exam?) • Descriptive statistics: what we see in the sample
Bivariate: two variables • Inferential statistics: generalizing sample conclusions to whole
(e.g. do students of population
di erent genders di er in
their grades?)
Variable: a condition or quality that can di er from one case to another
Multivariate: multiple
variables (e.g. is the
Case: an entity that displays or possesses the traits of a variable
grade dependent on
initial motivation, the
Unit of analysis will change depending on cases:
time spent on studying,
and gender?) - When data is put into a table, the unit of analysis is what the cases in
each row are (i.e. if there are specie names, then the unit of analysis is
species, or countries if there are country names)
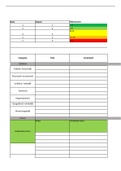
• LEVELS OF
MEASUREMENT
Description Example Measures of
central tendency
Nominal Group/category Discrete/categorical: E.g. religion, Mode
classi cations, no meaningful has nite number of country,
ranking is possible, numerical values (e.g. how many gender
coding is arbitrary children someone
has)
Ordinal Meaningful ranking (e.g. 3 is Discrete/categorical E.g. never, Median, mode
more than 2), but intervals once a week, a
between options is unknown/ few days, daily,
unequal Likert Scales
Interval Meaningful ranking, Continuous: can vary E.g. Mean, median,
distances between options in quantity by in nitely temperature in mode
are equal small degrees (e.g. degrees
height)
Ratio Meaningful ranking, equal Continuous E.g. age Mean, median,
distances, and absolute and mode
true zero point
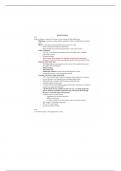
• MEASURES OF CENTRAL TENDENCY
Mean:
Most useful for describing normally distributed variables, for
interval/ratio variables, the median can be more useful than the
mean because it responds less to outliers than the mean.
Median:
Line up all cases from lowest to highest value and choose the
middle case (or value between the 2 middle cases when
sample is even number), used for interval/ratio variables that
have skewed distributions
Mode:
The category with the largest amount of cases
In a perfectly normal distribution, the mean, mode and median
are the same.
ff fi fi fi ff ff
, Lecture 2: Univariate analysis + Bivariate analysis
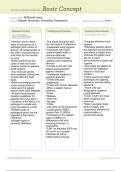
• MEASURES OF DISPERSION
The mean is useful when we also know how the cases are dispersed - can only be used for
interval
E.g. 10 people who are 20 years old and 10 people who are 60 years old have the same age mean
compared to a group with 10 people who are 39 years old and 10 people who are 41 years old
We need central tendency measures along with measures of dispersion to adequately describe
the distribution of variables.
Range (interval/ratio) Interquartile range (interval/ratio)
Distance between highest and lowest score Distance between Q3 (upper quartile) and Q1
Problem: responsive to outliers (lower quartile)
Quartiles split data into 4 equal groups of cases -
cut data in half, then cut the halves in half.
Standard deviation (interval/ratio)
How much cases deviate from the mean IQR tells us where the middle 50% of chases are
Top of the fraction: for each case (Xi), • Very low = cases are close together
calculate the distance from the mean, • Very high = cases are dispersed
square, and add all together.
Interpreting SD value:
Higher SD = more variance of scores (scores
are dispersed)
Lower SD = less variance of scores
(scores are clustered around one spot)
A measure of how much, on average,
cases are removed from the mean.
When comparing SDs across groups, we
can make comparative statements about
more/less dispersion around the mean.
We use sample SD to estimate population
SD
SPSS: Analyze —> descriptive statistics —>
• GINI COEFFICIENT frequencies (statistics to add measures of central
tendency/dispersion, charts to add bar chart)
0 = perfect equality
1 = 1 person has all the wealth
Gini coe cient = A/A+B
The bigger the area of A, the more unequal the situation is
• BIVARIATE REGRESSION Scatterplot:
How 2 variables are related to each other
Allows for the graphical representation of the
IV (x): a variable we expect to in uence another
relationship between 2 interval/ratio variables
variable in the model
DV (y): a variable we expect to be in uenced by at Regression analysis is the task of tting a
least one IV in the model straight line through a scatter plot of cases that
‘best ts’ the data
fi ffi fl fi fl
• CASES AND VARIABLES
Population: the set of all possible cases of interest
Univariate: one variable Sample: a set of cases that doesn’t include every member of the
(e.g. what is the average population
grade on the ISA exam?) • Descriptive statistics: what we see in the sample
Bivariate: two variables • Inferential statistics: generalizing sample conclusions to whole
(e.g. do students of population
di erent genders di er in
their grades?)
Variable: a condition or quality that can di er from one case to another
Multivariate: multiple
variables (e.g. is the
Case: an entity that displays or possesses the traits of a variable
grade dependent on
initial motivation, the
Unit of analysis will change depending on cases:
time spent on studying,
and gender?) - When data is put into a table, the unit of analysis is what the cases in
each row are (i.e. if there are specie names, then the unit of analysis is
species, or countries if there are country names)
• LEVELS OF
MEASUREMENT
Description Example Measures of
central tendency
Nominal Group/category Discrete/categorical: E.g. religion, Mode
classi cations, no meaningful has nite number of country,
ranking is possible, numerical values (e.g. how many gender
coding is arbitrary children someone
has)
Ordinal Meaningful ranking (e.g. 3 is Discrete/categorical E.g. never, Median, mode
more than 2), but intervals once a week, a
between options is unknown/ few days, daily,
unequal Likert Scales
Interval Meaningful ranking, Continuous: can vary E.g. Mean, median,
distances between options in quantity by in nitely temperature in mode
are equal small degrees (e.g. degrees
height)
Ratio Meaningful ranking, equal Continuous E.g. age Mean, median,
distances, and absolute and mode
true zero point
• MEASURES OF CENTRAL TENDENCY
Mean:
Most useful for describing normally distributed variables, for
interval/ratio variables, the median can be more useful than the
mean because it responds less to outliers than the mean.
Median:
Line up all cases from lowest to highest value and choose the
middle case (or value between the 2 middle cases when
sample is even number), used for interval/ratio variables that
have skewed distributions
Mode:
The category with the largest amount of cases
In a perfectly normal distribution, the mean, mode and median
are the same.
ff fi fi fi ff ff
, Lecture 2: Univariate analysis + Bivariate analysis
• MEASURES OF DISPERSION
The mean is useful when we also know how the cases are dispersed - can only be used for
interval
E.g. 10 people who are 20 years old and 10 people who are 60 years old have the same age mean
compared to a group with 10 people who are 39 years old and 10 people who are 41 years old
We need central tendency measures along with measures of dispersion to adequately describe
the distribution of variables.
Range (interval/ratio) Interquartile range (interval/ratio)
Distance between highest and lowest score Distance between Q3 (upper quartile) and Q1
Problem: responsive to outliers (lower quartile)
Quartiles split data into 4 equal groups of cases -
cut data in half, then cut the halves in half.
Standard deviation (interval/ratio)
How much cases deviate from the mean IQR tells us where the middle 50% of chases are
Top of the fraction: for each case (Xi), • Very low = cases are close together
calculate the distance from the mean, • Very high = cases are dispersed
square, and add all together.
Interpreting SD value:
Higher SD = more variance of scores (scores
are dispersed)
Lower SD = less variance of scores
(scores are clustered around one spot)
A measure of how much, on average,
cases are removed from the mean.
When comparing SDs across groups, we
can make comparative statements about
more/less dispersion around the mean.
We use sample SD to estimate population
SD
SPSS: Analyze —> descriptive statistics —>
• GINI COEFFICIENT frequencies (statistics to add measures of central
tendency/dispersion, charts to add bar chart)
0 = perfect equality
1 = 1 person has all the wealth
Gini coe cient = A/A+B
The bigger the area of A, the more unequal the situation is
• BIVARIATE REGRESSION Scatterplot:
How 2 variables are related to each other
Allows for the graphical representation of the
IV (x): a variable we expect to in uence another
relationship between 2 interval/ratio variables
variable in the model
DV (y): a variable we expect to be in uenced by at Regression analysis is the task of tting a
least one IV in the model straight line through a scatter plot of cases that
‘best ts’ the data
fi ffi fl fi fl