Gizmo- Rainfall and Bird Beaks
***make a copy of this, add your Full name at the end of the file name, delete “copy of” from the beginning, and save in your
Biology Folder in your PAUSD Google Drive.
Selective Advantage: I can apply concepts of statistics and probability to support explanations that organisms with an
advantageous heritable trait tend to increase in proportion to organisms lacking this trait.
Vocabulary: adaptation, beak depth, directional selection, drought, evolution, natural selection, range, stabilizing selection
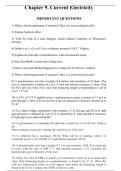
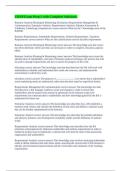
Preview: During the voyage of the HMS Beagle (1831–1836), the young Charles Darwin collected several species of finches from the
Galápagos Islands. Two of Darwin’s finches are shown below. Geospiza Magnirostris is the Large Ground Finch. Geospiza Fortis is
the Medium Ground Finch.
1. Which species do you think is best adapted to a diet of small, delicate seeds? Explain why you think so.
Geospiza fortis because it would fit in their mouth
2. Which species do you think is best adapted to a diet of large, tough-to-crack seeds? Explain.
They are bigger and fill their appetite
Procedure:
1. Go to your ClassLink LaunchPad
2. Once in ClassLink, go to “Explore Gizmos”
3. Once in Gizmos, open your Biology Class from “My Classes” and then “launch” the activity Rainfall and Bird Beaks - Metric.
, Gizmo Warm-up: Rainfall and Bird Beaks
Darwin’s finches are one of many types of animals on the Galápagos Islands that have
unique adaptations, or traits that help an organism survive in its environment. The Rainfall
and Bird Beaks Gizmo allows you to explore how rainfall influences the range of beak
shapes found in a single finch species.
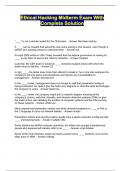
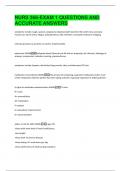
1. The beak depth of a finch is the distance from the top of the beak to the bottom. In the
main Gizmo picture, it will always show the average beak depth. Note the current
average beak depth in the picture here is 9.87__
2. Look at the HISTOGRAM to the right. A histogram is a type of graph showing a
distribution of traits within a population.
A. Note that the finches show variation and do NOT all have the same beak depth.
B. The size of the finch population is shown in the upper right hand corner (circled in
red) and is currently 1000__
C. The Mode is the most common finch beak depth, or the value for the tallest
column. In this Histogram, the mode is _10_
D. The Range is the series of values on the X-axis that have any data. In this
Histogram, the range is _6-13_
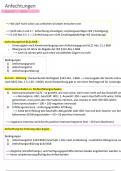
3. Click Play ( ) and let the simulation play for five years with average rainfall (25
cm/yr). Select the GRAPH tab and view the Finches vs time and Beak depth vs time
graphs.
A. How does the finch population change? ___It decreases a bit___
B. Does the average beak depth change significantly by the end of 5 years?_It stayed the same with less population_______
***make a copy of this, add your Full name at the end of the file name, delete “copy of” from the beginning, and save in your
Biology Folder in your PAUSD Google Drive.
Selective Advantage: I can apply concepts of statistics and probability to support explanations that organisms with an
advantageous heritable trait tend to increase in proportion to organisms lacking this trait.
Vocabulary: adaptation, beak depth, directional selection, drought, evolution, natural selection, range, stabilizing selection
Preview: During the voyage of the HMS Beagle (1831–1836), the young Charles Darwin collected several species of finches from the
Galápagos Islands. Two of Darwin’s finches are shown below. Geospiza Magnirostris is the Large Ground Finch. Geospiza Fortis is
the Medium Ground Finch.
1. Which species do you think is best adapted to a diet of small, delicate seeds? Explain why you think so.
Geospiza fortis because it would fit in their mouth
2. Which species do you think is best adapted to a diet of large, tough-to-crack seeds? Explain.
They are bigger and fill their appetite
Procedure:
1. Go to your ClassLink LaunchPad
2. Once in ClassLink, go to “Explore Gizmos”
3. Once in Gizmos, open your Biology Class from “My Classes” and then “launch” the activity Rainfall and Bird Beaks - Metric.
, Gizmo Warm-up: Rainfall and Bird Beaks
Darwin’s finches are one of many types of animals on the Galápagos Islands that have
unique adaptations, or traits that help an organism survive in its environment. The Rainfall
and Bird Beaks Gizmo allows you to explore how rainfall influences the range of beak
shapes found in a single finch species.
1. The beak depth of a finch is the distance from the top of the beak to the bottom. In the
main Gizmo picture, it will always show the average beak depth. Note the current
average beak depth in the picture here is 9.87__
2. Look at the HISTOGRAM to the right. A histogram is a type of graph showing a
distribution of traits within a population.
A. Note that the finches show variation and do NOT all have the same beak depth.
B. The size of the finch population is shown in the upper right hand corner (circled in
red) and is currently 1000__
C. The Mode is the most common finch beak depth, or the value for the tallest
column. In this Histogram, the mode is _10_
D. The Range is the series of values on the X-axis that have any data. In this
Histogram, the range is _6-13_
3. Click Play ( ) and let the simulation play for five years with average rainfall (25
cm/yr). Select the GRAPH tab and view the Finches vs time and Beak depth vs time
graphs.
A. How does the finch population change? ___It decreases a bit___
B. Does the average beak depth change significantly by the end of 5 years?_It stayed the same with less population_______