Discrete dala variable of which
: X can only yield isolated values
,
some are often repeated
·
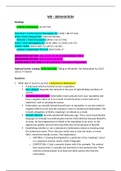
Ordinal : categories have a natural ordering
Bur Charts : firs
& Football league, Premier league the
frequencies and
·
Nominal :
No natural ordering to the categories the relative frequencies
↳ Gende : Male , female
A variable that the of certain
Count
·
:
represents count events
↳ Number of children in household : 0. 1 ,
2
,
3 etc
Continous dala : Variable Y is centinous if it can assure
any value taken from a continuum/interval/rarge of numbers
i height weight incope distribution grash
.
e
,
, government expenditure >
- Histogram : raw data grouped
into intervals &
histyram
=
& find frequery fregers
(a) (fraentr)
relable
,
and dis
Cross-section data : taken at point in time
observation on a
particular variable a
single
for example : anneal Crime figure recorded in 1999, initial salsies of DOM
grads in 2012
, Minterparate & Several cities on a .
single day
Time-series dala : fire
Observation on a
particular variable recorded over a
period of at
regular intervals
for example :
Personal Grime figures in Manchester recorded annually from 1900 -
2022
,
Monthly household expendine on food ,
oil grive over lo years
↳ can be represerved a live
graphs
↳ for daka with different axies -> on excel crak a combo live
gragh with relationship between two variables
Secudey axis steen in the scatter flot
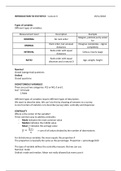
Location Measures : Central location/Cernal Fendency/average
& what a typical value from a set of observations is
& value around which observations in the sample are distributed
.
applicable for continous dala
The Mean :& only
Arithmetic Man = )
= =
. ...
n
adding all values in a sample and dividing this by the sample Size.
Mean of binary variables :
,The I applied
for both continue and discre daca
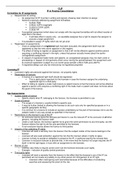
Median : e finding the middle value of a sampl
Median value Middle value of the data in (smalles to biggest
5Menuvalve
:
set order
organized
tradaa b
ar
Medium doesn't use all data
= less influenced
If dala set is positive skence : Man) Median by outliers
4 If highes value increases - man changes ,
median stays the same
↳ Mean is allded by extreme value skewed
- right
If
*
dala
For
set
symrehic
is
data
regaliely
- mean
skewed
and
: Mean
Median
<Median
are similar M
- - -
2, 6 8, 9 100
, ,
regellin sler
weighted mean : positive Symmetric
S kew
reformulate the arithmetic mean to the following equivalent formula weighted mem :
In
= Wi + we ... twn
=
& = M
+...
= x + x + ....
+ Y
take for of the variables isn't the
& we can't the arithmetic mean certain data types if the size same
alled in the of indes
weighted Mean is used construction numbers
ie - consumer price index (CPE)
↳ eighing calegories differently like food us music
Exable question :
6 , 241
S Pop prop
=
: VE = 9 9 . % = , 0002
0 all
452, 189
11 Poy
=
D : VE = . 0 % Prop = 0 . 02132
WE = 7, 457 , 632
N : 1 % %.
Pop =
Prop = 0 .
3515
6269
G : WE = 16 . 6% pay = 13, 298, 115 Prop = 0 .
total = 71 .
2%
tolal = 21 ,
214 , 177
29 9 .
(0 0002941) . + 11(0 02132).
+ 13 . 9 (0 .
3515) +
16 . 4(0 6269) . =
15 41
.
, Percentiles : - in EXCELL PERCENTILE
EXOCAxc ercantie
.
vale
dala
(
between
smalle bigger
nI i
und
all
including
inc :
and
Smallis
bigge
!
58 99 - 99th percentile
Median exceeding
where 1% earn income
F th
rell capy who less
- ame↳: eurn
F 2
345678910
It, 18, 23 28 30 , 35 , 39 , 48 59 , 80
, , ,
50th Median t5 32.
percentile = = =
18th percentile : One observation <18 and eight <18
: I/(I + 8) : 1/9 = 0 .
111111 or 11 11 %
. of observations are lover than 18
2/2 + 7) 2/9 22 22 22 %
percentiv
0
23rd =
= = = .
.
To calculate the 20th percentin :
4
0 3 20
.
.
example : ↑
Y S 6 7 8 9 10
3
is,
18 , 23, 38
,
30
,
35
,
09, 48 , 59
, 80
27th percenble ?
/(3
2
319 0 33 = 33 %
20th percentive = 3 + 3) = = .
23rd 22 22 %
percentive
.
=
27th in between 22 22
percentile = and 33 %
.
(0 27 12/9)/(1(9) (28 23) =
2370 4)
23 + 25 15
-
.
- ·
. . 5 = .
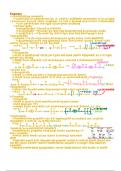
Deviation : How much the values in a
saigh differ from one another
range =
largest
-
Smallest
↳ Not ideal due to
cuiliers and
only uses the two extremes
.
Mea
Dispersions from central location : Example where and - =
Sample x Xi di Sargle Y Yi di
I
I 6 2 8 Y
di = xi -
2 3 2 3 I di
I =
j j
-
- -
3 3 3
↳ from the
airhidic mean
-
+ 3 I deciations
observed value -
Mean
, & How for dala set is from the mean
Sample variance :
each
Mean absolute deciatio (MAD) :
E lail = x - >
Mean squared deviation [MSD) : n di = (x -
1)
↳ variance
If dala represents releas population MSD =
Population variance (02)
↳
samyl rainne (c) = (xi -
x) n-1 =
degrees of freed on
values
& Max number of logically independent
S2(x) = (2)3 ( 1)" + 1 13
Example + disadvantages for data :
-
=
variance
-
:
2
-
= (4) + 1 + 1
has interpretation in chir of variance
2
·
vanience no
easy income dala = found
6
& - what is the
2
squared of meaning ?
= 3 to
·
variances for different dala sals are almost impossible compare
( 12 ( - 33
5(y) =
= (4) + -
+
+ (1) + (9)
= (16)
I 13
Standard deciation :
Population standard deviation : 0 = = (xi - ul"
= =
S(xi
standard deviation : S
sanyle n -
1
- 2)
Example :
1 2 7 7 10 , 18
, , , ,
* = 7
S
~
= = ( 6) + ( 5) -
+ (0) + (0) (3)
+ + (832
# (36) + (25) + (9) + (64)
-
= 26 . 8
: X can only yield isolated values
,
some are often repeated
·
Ordinal : categories have a natural ordering
Bur Charts : firs
& Football league, Premier league the
frequencies and
·
Nominal :
No natural ordering to the categories the relative frequencies
↳ Gende : Male , female
A variable that the of certain
Count
·
:
represents count events
↳ Number of children in household : 0. 1 ,
2
,
3 etc
Continous dala : Variable Y is centinous if it can assure
any value taken from a continuum/interval/rarge of numbers
i height weight incope distribution grash
.
e
,
, government expenditure >
- Histogram : raw data grouped
into intervals &
histyram
=
& find frequery fregers
(a) (fraentr)
relable
,
and dis
Cross-section data : taken at point in time
observation on a
particular variable a
single
for example : anneal Crime figure recorded in 1999, initial salsies of DOM
grads in 2012
, Minterparate & Several cities on a .
single day
Time-series dala : fire
Observation on a
particular variable recorded over a
period of at
regular intervals
for example :
Personal Grime figures in Manchester recorded annually from 1900 -
2022
,
Monthly household expendine on food ,
oil grive over lo years
↳ can be represerved a live
graphs
↳ for daka with different axies -> on excel crak a combo live
gragh with relationship between two variables
Secudey axis steen in the scatter flot
Location Measures : Central location/Cernal Fendency/average
& what a typical value from a set of observations is
& value around which observations in the sample are distributed
.
applicable for continous dala
The Mean :& only
Arithmetic Man = )
= =
. ...
n
adding all values in a sample and dividing this by the sample Size.
Mean of binary variables :
,The I applied
for both continue and discre daca
Median : e finding the middle value of a sampl
Median value Middle value of the data in (smalles to biggest
5Menuvalve
:
set order
organized
tradaa b
ar
Medium doesn't use all data
= less influenced
If dala set is positive skence : Man) Median by outliers
4 If highes value increases - man changes ,
median stays the same
↳ Mean is allded by extreme value skewed
- right
If
*
dala
For
set
symrehic
is
data
regaliely
- mean
skewed
and
: Mean
Median
<Median
are similar M
- - -
2, 6 8, 9 100
, ,
regellin sler
weighted mean : positive Symmetric
S kew
reformulate the arithmetic mean to the following equivalent formula weighted mem :
In
= Wi + we ... twn
=
& = M
+...
= x + x + ....
+ Y
take for of the variables isn't the
& we can't the arithmetic mean certain data types if the size same
alled in the of indes
weighted Mean is used construction numbers
ie - consumer price index (CPE)
↳ eighing calegories differently like food us music
Exable question :
6 , 241
S Pop prop
=
: VE = 9 9 . % = , 0002
0 all
452, 189
11 Poy
=
D : VE = . 0 % Prop = 0 . 02132
WE = 7, 457 , 632
N : 1 % %.
Pop =
Prop = 0 .
3515
6269
G : WE = 16 . 6% pay = 13, 298, 115 Prop = 0 .
total = 71 .
2%
tolal = 21 ,
214 , 177
29 9 .
(0 0002941) . + 11(0 02132).
+ 13 . 9 (0 .
3515) +
16 . 4(0 6269) . =
15 41
.
, Percentiles : - in EXCELL PERCENTILE
EXOCAxc ercantie
.
vale
dala
(
between
smalle bigger
nI i
und
all
including
inc :
and
Smallis
bigge
!
58 99 - 99th percentile
Median exceeding
where 1% earn income
F th
rell capy who less
- ame↳: eurn
F 2
345678910
It, 18, 23 28 30 , 35 , 39 , 48 59 , 80
, , ,
50th Median t5 32.
percentile = = =
18th percentile : One observation <18 and eight <18
: I/(I + 8) : 1/9 = 0 .
111111 or 11 11 %
. of observations are lover than 18
2/2 + 7) 2/9 22 22 22 %
percentiv
0
23rd =
= = = .
.
To calculate the 20th percentin :
4
0 3 20
.
.
example : ↑
Y S 6 7 8 9 10
3
is,
18 , 23, 38
,
30
,
35
,
09, 48 , 59
, 80
27th percenble ?
/(3
2
319 0 33 = 33 %
20th percentive = 3 + 3) = = .
23rd 22 22 %
percentive
.
=
27th in between 22 22
percentile = and 33 %
.
(0 27 12/9)/(1(9) (28 23) =
2370 4)
23 + 25 15
-
.
- ·
. . 5 = .
Deviation : How much the values in a
saigh differ from one another
range =
largest
-
Smallest
↳ Not ideal due to
cuiliers and
only uses the two extremes
.
Mea
Dispersions from central location : Example where and - =
Sample x Xi di Sargle Y Yi di
I
I 6 2 8 Y
di = xi -
2 3 2 3 I di
I =
j j
-
- -
3 3 3
↳ from the
airhidic mean
-
+ 3 I deciations
observed value -
Mean
, & How for dala set is from the mean
Sample variance :
each
Mean absolute deciatio (MAD) :
E lail = x - >
Mean squared deviation [MSD) : n di = (x -
1)
↳ variance
If dala represents releas population MSD =
Population variance (02)
↳
samyl rainne (c) = (xi -
x) n-1 =
degrees of freed on
values
& Max number of logically independent
S2(x) = (2)3 ( 1)" + 1 13
Example + disadvantages for data :
-
=
variance
-
:
2
-
= (4) + 1 + 1
has interpretation in chir of variance
2
·
vanience no
easy income dala = found
6
& - what is the
2
squared of meaning ?
= 3 to
·
variances for different dala sals are almost impossible compare
( 12 ( - 33
5(y) =
= (4) + -
+
+ (1) + (9)
= (16)
I 13
Standard deciation :
Population standard deviation : 0 = = (xi - ul"
= =
S(xi
standard deviation : S
sanyle n -
1
- 2)
Example :
1 2 7 7 10 , 18
, , , ,
* = 7
S
~
= = ( 6) + ( 5) -
+ (0) + (0) (3)
+ + (832
# (36) + (25) + (9) + (64)
-
= 26 . 8