

Ch 10: The T Test for 2 Independent Samples
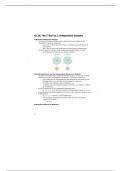
Independent-Measures Designs
the research designs that are used to obtain the 2 sets of data can be
classified in 2 general categories:
o the 2 sets of data could come from 2 completely separate groups of
participants
o the 2 sets of data could come from the same group of participants
the first research strategy, using completely separate groups, is called:
o an independent-measures or a between-subject
The Null Hypothesis and the Independent-Measures t Statistic
the goal of an independent-measures research study is to evaluate the mean
difference between 2 populations (or between 2 treatment conditions)
o using subscripts to differentiate the two populations, the mean for the
first population is μ1, and the second population mean is μ2
o the difference between means is simply μ1 – μ2
o as always, the null hypothesis states that there is no change, no effect,
or no difference
the null hypothesis for the independent-measures test:
o H0 : μ1 – μ2 = 0 (no difference between the population means; μ1 = μ2)
the alternative hypothesis states that there is a mean difference between the
2 populations:
o H1 : μ1 – μ2 ≠ 0 (there is a mean difference)
o the alternative hypothesis can simply state that the 2 population
means are not equal
μ 1 ≠ μ2
Independent-Measures Notations
1
, The Formulas for an Independent-Measures Hypothesis Test
the independent-measures t uses the difference between 2 sample means to
evaluate a hypothesis about the difference between 2 population means
o thus, the independent-measures t formula is:
in each of the t-score formulas, the standard error in the denominator
measures how accurately the sample statistic represents the population
parameter
o in the single-sample t formula, the standard error measures the
amount of error expected for a sample mean and is represented by SM
for the independent-measures t formula, the standard error measures the
amount of error that is expected when you use a sample mean difference (M1
– M2) to represent a population mean difference (μ1 – μ2)
o the standard error for the sample mean difference is represented by
the symbol S(M1 – M2)
Calculating the Estimated Standard Error
to develop the formula for S(M1 – M2) we consider 3 points:
o each of the 2-sample means represents its own population mean, but
in each case there is some error
o the amount of error associated with each sample mean is measured by
the estimated standard error of M
o for the independent-measures t statistic, we want to know the total
amount of error involved in using 2 sample means to approximate 2
population means
to do this, if the samples are the same size, we will find the error
from each sample separately and then add the 2 errors together
when the samples are of different sizes, a pooled, or average,
estimate (that allows the bigger sample to carry more weight in
determining the final value) is used
Hypothesis Tests and Effect Size with the Independent-Measures t Statistic
2
Independent-Measures Designs
the research designs that are used to obtain the 2 sets of data can be
classified in 2 general categories:
o the 2 sets of data could come from 2 completely separate groups of
participants
o the 2 sets of data could come from the same group of participants
the first research strategy, using completely separate groups, is called:
o an independent-measures or a between-subject
The Null Hypothesis and the Independent-Measures t Statistic
the goal of an independent-measures research study is to evaluate the mean
difference between 2 populations (or between 2 treatment conditions)
o using subscripts to differentiate the two populations, the mean for the
first population is μ1, and the second population mean is μ2
o the difference between means is simply μ1 – μ2
o as always, the null hypothesis states that there is no change, no effect,
or no difference
the null hypothesis for the independent-measures test:
o H0 : μ1 – μ2 = 0 (no difference between the population means; μ1 = μ2)
the alternative hypothesis states that there is a mean difference between the
2 populations:
o H1 : μ1 – μ2 ≠ 0 (there is a mean difference)
o the alternative hypothesis can simply state that the 2 population
means are not equal
μ 1 ≠ μ2
Independent-Measures Notations
1
, The Formulas for an Independent-Measures Hypothesis Test
the independent-measures t uses the difference between 2 sample means to
evaluate a hypothesis about the difference between 2 population means
o thus, the independent-measures t formula is:
in each of the t-score formulas, the standard error in the denominator
measures how accurately the sample statistic represents the population
parameter
o in the single-sample t formula, the standard error measures the
amount of error expected for a sample mean and is represented by SM
for the independent-measures t formula, the standard error measures the
amount of error that is expected when you use a sample mean difference (M1
– M2) to represent a population mean difference (μ1 – μ2)
o the standard error for the sample mean difference is represented by
the symbol S(M1 – M2)
Calculating the Estimated Standard Error
to develop the formula for S(M1 – M2) we consider 3 points:
o each of the 2-sample means represents its own population mean, but
in each case there is some error
o the amount of error associated with each sample mean is measured by
the estimated standard error of M
o for the independent-measures t statistic, we want to know the total
amount of error involved in using 2 sample means to approximate 2
population means
to do this, if the samples are the same size, we will find the error
from each sample separately and then add the 2 errors together
when the samples are of different sizes, a pooled, or average,
estimate (that allows the bigger sample to carry more weight in
determining the final value) is used
Hypothesis Tests and Effect Size with the Independent-Measures t Statistic
2


