

Ch 16: Introduction to Regression
Intro to Linear Equations and Regression
the Pearson correlation measures the degree to which a set of data points
form a straight line relationship
regression is a statistical procedure that determines the equation for the
straight line that best fits a specific set of data
o the resulting straight line is called the regression line
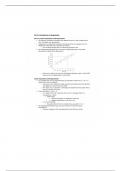
the relationship between SAT scores and college GPA with a line drawn
through the middle of the data points
o the line is a precise one to one relationship between each X value (SAT
score) and a corresponding Y value (GPA)
Linear Equations and Regression
any straight line can be represented by an equation of the form y = bx + a,
where b and a are constants
o the value of b is called the slope constant and determines the direction
and degree to which the line is tilted
o the value of a is called the y-intercept and determines the point where
the line crosses the y-axis
linear equations y = bx + a:
o b = slope of the line; measures how much Y changes when X is
increased by 1 point
determines:
direction (positive or negative) of the line
degree (steepness) of the line’s tilt
o a = the y-intercept
the point where the line crosses the y-axis when X = 0
the relationship between total cost and number of months of gym
membership
o the gym charges a $35 membership fee and $15 per month
, o the relationship is described by a linear equation y = 15x + 35, where
Y is the total cost and X is the number of months
Linear Regression
to determine how well a set of data points fits a straight line:
o we calculate the distance between all data points and the line
o goal find the predicted value of Ŷ for any X
the accuracy of this prediction depends on:
o error (distance) between the predicted value and the actual value
o or Y – Ŷ
things to consider about linear regressions:
o relationship to correlations – magnitude of regression error is related to
strength of correlation
r = 1, all points fit on the line
r = 0, horizontal line along y-intercept
related to direction of correlation = direction of regression line
o regression line always passes through MX and MY
Intro to Linear Equations and Regression
the Pearson correlation measures the degree to which a set of data points
form a straight line relationship
regression is a statistical procedure that determines the equation for the
straight line that best fits a specific set of data
o the resulting straight line is called the regression line
the relationship between SAT scores and college GPA with a line drawn
through the middle of the data points
o the line is a precise one to one relationship between each X value (SAT
score) and a corresponding Y value (GPA)
Linear Equations and Regression
any straight line can be represented by an equation of the form y = bx + a,
where b and a are constants
o the value of b is called the slope constant and determines the direction
and degree to which the line is tilted
o the value of a is called the y-intercept and determines the point where
the line crosses the y-axis
linear equations y = bx + a:
o b = slope of the line; measures how much Y changes when X is
increased by 1 point
determines:
direction (positive or negative) of the line
degree (steepness) of the line’s tilt
o a = the y-intercept
the point where the line crosses the y-axis when X = 0
the relationship between total cost and number of months of gym
membership
o the gym charges a $35 membership fee and $15 per month
, o the relationship is described by a linear equation y = 15x + 35, where
Y is the total cost and X is the number of months
Linear Regression
to determine how well a set of data points fits a straight line:
o we calculate the distance between all data points and the line
o goal find the predicted value of Ŷ for any X
the accuracy of this prediction depends on:
o error (distance) between the predicted value and the actual value
o or Y – Ŷ
things to consider about linear regressions:
o relationship to correlations – magnitude of regression error is related to
strength of correlation
r = 1, all points fit on the line
r = 0, horizontal line along y-intercept
related to direction of correlation = direction of regression line
o regression line always passes through MX and MY


