Please check the examination details below before entering your candidate information
Candidate surname Other names
Centre Number Candidate Number
Pearson Edexcel International Advanced Level
Wednesday 10 January 2024
Afternoon (Time: 1 hour 30 minutes) Paper
reference WST01/01
⯁ ⯁
Mathematics
International Advanced Subsidiary/Advanced Level
Statistics S1
You must have: Total Marks
Mathematical Formulae and Statistical Tables (Yellow), calculator
Pearson Edexcel International Advanced Level Mathematics International Advanced Subsidiary/Advanced Level
Statistics S1 QP JAN 2024
Candidates may use any calculator permitted by Pearson regulations. Calculators
must not have the facility for symbolic algebra manipulation, differentiation and
integration, or have retrievable mathematical formulae stored in them.
Instructions
•• Use black ink or ball‑point pen.
• If pencil is used for diagrams/sketches/graphs it must be dark (HB or B).
Fill in the boxes at the top of this page with your name,
••
centre number and candidate number.
Answer all questions and ensure that your answers to parts of questions are clearly labelled.
Answer the questions in the spaces provided
•
– there may be more space than you need.
You should show sufficient working to make your methods clear. Answers without working
• may not gain full credit.
Values from the statistical tables should be quoted in full. If a calculator is used instead of the
• tables, the value should be given to an equivalent degree of accuracy.
Inexact answers should be given to three significant figures unless otherwise stated.
Information
•• A booklet ‘Mathematical Formulae and Statistical Tables’ is provided.
There are 8for
The marks questions in this question
each question are shownpaper. The total mark for this paper is 75.
in brackets
– use this as a guide as to how much time to spend on each question.
Advice
•• Read each question carefully before you start to answer it.
•• Try to answer every question.
Check your answers if you have time at the end.
If you change your mind about an answer, cross it out and put your new answer and any
working underneath.
Turn over
P74320A
©2024 Pearson Education Ltd.
S:1/1/1/
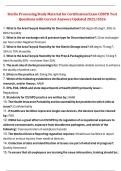
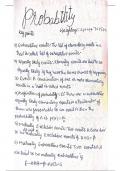
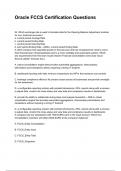
,1. The histogram below shows the distribution of the heights, to the nearest cm,
of 408 plants.
DO NOT WRITE IN THIS AREA
Frequency
density
DO NOT WRITE IN THIS AREA
0 5 10 15 20 25
Height (cm)
(a) Use the histogram to complete the following table.
Height (h cm) 5 h< 9 9 h < 13 13 h < 15 15 h < 17 17 h < 25
Frequency 32 152 120
(2)
(b) Use interpolation to estimate the median.
(2)
The mean height of these plants is 13.2 cm correct to one decimal place.
(c) Describe the skew of these data. Give a reason for your answer.
DO NOT WRITE IN THIS AREA
(1)
Two of these plants are chosen at random.
(d) Estimate the probability that both of their heights are between 8 cm and 14 cm
(3)
2
■■■■
,
DO NOT WRITE IN THIS AREA DO NOT WRITE IN THIS AREA DO NOT WRITE IN THIS AREA
■■■■
Question 1 continued
3
Turn over
Candidate surname Other names
Centre Number Candidate Number
Pearson Edexcel International Advanced Level
Wednesday 10 January 2024
Afternoon (Time: 1 hour 30 minutes) Paper
reference WST01/01
⯁ ⯁
Mathematics
International Advanced Subsidiary/Advanced Level
Statistics S1
You must have: Total Marks
Mathematical Formulae and Statistical Tables (Yellow), calculator
Pearson Edexcel International Advanced Level Mathematics International Advanced Subsidiary/Advanced Level
Statistics S1 QP JAN 2024
Candidates may use any calculator permitted by Pearson regulations. Calculators
must not have the facility for symbolic algebra manipulation, differentiation and
integration, or have retrievable mathematical formulae stored in them.
Instructions
•• Use black ink or ball‑point pen.
• If pencil is used for diagrams/sketches/graphs it must be dark (HB or B).
Fill in the boxes at the top of this page with your name,
••
centre number and candidate number.
Answer all questions and ensure that your answers to parts of questions are clearly labelled.
Answer the questions in the spaces provided
•
– there may be more space than you need.
You should show sufficient working to make your methods clear. Answers without working
• may not gain full credit.
Values from the statistical tables should be quoted in full. If a calculator is used instead of the
• tables, the value should be given to an equivalent degree of accuracy.
Inexact answers should be given to three significant figures unless otherwise stated.
Information
•• A booklet ‘Mathematical Formulae and Statistical Tables’ is provided.
There are 8for
The marks questions in this question
each question are shownpaper. The total mark for this paper is 75.
in brackets
– use this as a guide as to how much time to spend on each question.
Advice
•• Read each question carefully before you start to answer it.
•• Try to answer every question.
Check your answers if you have time at the end.
If you change your mind about an answer, cross it out and put your new answer and any
working underneath.
Turn over
P74320A
©2024 Pearson Education Ltd.
S:1/1/1/
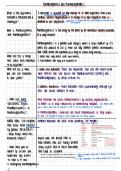
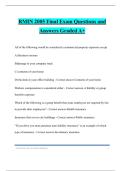
,1. The histogram below shows the distribution of the heights, to the nearest cm,
of 408 plants.
DO NOT WRITE IN THIS AREA
Frequency
density
DO NOT WRITE IN THIS AREA
0 5 10 15 20 25
Height (cm)
(a) Use the histogram to complete the following table.
Height (h cm) 5 h< 9 9 h < 13 13 h < 15 15 h < 17 17 h < 25
Frequency 32 152 120
(2)
(b) Use interpolation to estimate the median.
(2)
The mean height of these plants is 13.2 cm correct to one decimal place.
(c) Describe the skew of these data. Give a reason for your answer.
DO NOT WRITE IN THIS AREA
(1)
Two of these plants are chosen at random.
(d) Estimate the probability that both of their heights are between 8 cm and 14 cm
(3)
2
■■■■
,
DO NOT WRITE IN THIS AREA DO NOT WRITE IN THIS AREA DO NOT WRITE IN THIS AREA
■■■■
Question 1 continued
3
Turn over