Unit 1: Prosperity, Inequality, and Planetary Limits:
Whilst some countries were better off than others, for much of history the world was economically flat: the
differences in living standards were between the rich and poor in any given country than the differences across
regions globally. However, when looking at today’s world, while people are better off than they were centuries ago
(due to access to better diets, sanitation and control of infectious diseases leading to greater life expectancy), most
are considered poor by current standards as living standards have improved unequally throughout the world.
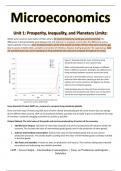
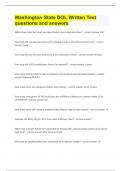
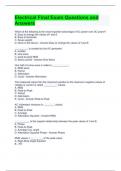
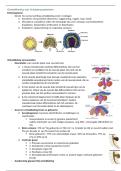
Figure 1 illustrates that for much of history, living
standards did not grow in any sustained way.
When sustained growth occurred, it began at different
times in different countries, leading to vast differences in
living standards between countries around the world.
Since late in the twentieth century, ‘latecomers’ such as
India and China have been catching up with the richer
nations, but in some countries, like Nigeria, the hockey
stick has not yet tipped upwards.
Understanding why over the past three centuries some
countries have prospered and others have not has been
one of the most important questions in economics.
Figure 1: History’s hockey stick curves: gross domestic product per
capita in five countries (1000–2018).
Gross Domestic Product (GDP) as a measure to compare living standards globally.
There are three ways of measuring GDP, each of which should theoretically give the same answer (but can diverge
due to different data sources). GDP can be produced monthly, quarterly and annually to give an estimate of the state
of countries’ constantly changing economies as quickly as possible.
Output Method: The total value of the goods and services produced by all sectors of the economy.
1. Identify Gross Output: Calculate the total value of goods and services produced by all industries within the
economy. This includes the value of intermediate goods (goods used in the production of other goods).
2. Subtract Intermediate Consumption: Subtract the value of intermediate goods and services used in
production processes. This avoids double counting since the value of intermediate goods is already included
in the final goods.
3. Add Taxes and Subsidies: Include net taxes on production and imports. This involves adding taxes imposed
on products and subtracting any subsidies provided.
GDP = Gross Output – Intermediate Consumption + Taxes on Production and Imports –
Subsidies
, Income Method: The value of the income generated from land, labour, capital and entrepreneurship.
1. Wages and Salaries (Compensation of Employees): This includes all forms of compensation to employees
such as wages, salaries, and social contributions (both by employees and employers).
2. Gross Operating Surplus (Profits): This represents the profits of companies before taxes, including rents and
royalties. It can be divided into:
• Gross Mixed Income: Income of self-employed individuals, incorporating both labour and capital.
• Gross Operating Surplus: Profits of incorporated businesses.
3. Net Taxes on Production and Imports: This includes taxes on production and imports minus subsidies.
Examples of taxes are VAT and excise duties, and examples of subsidies are government payments to farmers.
GDP = Compensation of Employees + Gross Operating Surplus + Gross Mixed Income +
Net Taxes on Production and Imports
Expenditure Method: The value of total spending on goods and services produced within an economy.
1. Consumption: Total spending by households on goods and services. This includes expenditures on durable
goods (cars, appliances), nondurable goods (food, clothing), and services (healthcare, education).
2. Investment: Total spending on capital goods that will be used for future production. This includes business
investments in equipment and structures, residential construction, and changes in business inventories.
3. Government Spending: Total government expenditures on goods and services. This includes spending on
defence, education, public safety, and infrastructure. It does not include transfer payments like pensions and
unemployment benefits, as these do not correspond to production of goods and services.
4. Net Exports: The value of a country's exports minus the value of its imports. Exports add to a country's GDP
because they are produced domestically, while imports are subtracted because they represent spending on
goods and services produced outside the country.
GDP = Consumption + Investment + Government Spending + (Exports – Imports)
Benefits of Using GDP as a Measure of Living Limitations of Using GDP as a Measure of Living
Standards Standards
• Broad Indicator of Economic Activity: GDP per • Excludes Non-Market Activities: GDP does not
capita measures total output, which includes account for household production (e.g., meals,
goods and services essential for daily life and childcare) and other non-market activities that
enjoyment. contribute to well-being.
• Correlation with Well-being: GDP per capita is • Ignores Quality of Life Factors: Factors like social
highly correlated with other well-being relationships, clean air, personal safety, and leisure
measures, such as life expectancy and self- time are not measured by GDP.
reported life satisfaction. • Does Not Reflect Income Distribution: GDP per capita
• Standardized Comparison: It allows for measures average output but ignores how this output
standardized comparisons across different is distributed, masking income inequality where some
countries and over time, facilitating international individuals may be significantly worse off despite high
and historical economic analysis. average GDP.
• Data Availability and Regular Updates: GDP • Environmental Depletion: GDP does not consider the
data is widely available and regularly updated, depletion of natural resources or environmental
Whilst some countries were better off than others, for much of history the world was economically flat: the
differences in living standards were between the rich and poor in any given country than the differences across
regions globally. However, when looking at today’s world, while people are better off than they were centuries ago
(due to access to better diets, sanitation and control of infectious diseases leading to greater life expectancy), most
are considered poor by current standards as living standards have improved unequally throughout the world.
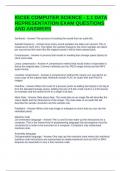
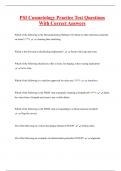
Figure 1 illustrates that for much of history, living
standards did not grow in any sustained way.
When sustained growth occurred, it began at different
times in different countries, leading to vast differences in
living standards between countries around the world.
Since late in the twentieth century, ‘latecomers’ such as
India and China have been catching up with the richer
nations, but in some countries, like Nigeria, the hockey
stick has not yet tipped upwards.
Understanding why over the past three centuries some
countries have prospered and others have not has been
one of the most important questions in economics.
Figure 1: History’s hockey stick curves: gross domestic product per
capita in five countries (1000–2018).
Gross Domestic Product (GDP) as a measure to compare living standards globally.
There are three ways of measuring GDP, each of which should theoretically give the same answer (but can diverge
due to different data sources). GDP can be produced monthly, quarterly and annually to give an estimate of the state
of countries’ constantly changing economies as quickly as possible.
Output Method: The total value of the goods and services produced by all sectors of the economy.
1. Identify Gross Output: Calculate the total value of goods and services produced by all industries within the
economy. This includes the value of intermediate goods (goods used in the production of other goods).
2. Subtract Intermediate Consumption: Subtract the value of intermediate goods and services used in
production processes. This avoids double counting since the value of intermediate goods is already included
in the final goods.
3. Add Taxes and Subsidies: Include net taxes on production and imports. This involves adding taxes imposed
on products and subtracting any subsidies provided.
GDP = Gross Output – Intermediate Consumption + Taxes on Production and Imports –
Subsidies
, Income Method: The value of the income generated from land, labour, capital and entrepreneurship.
1. Wages and Salaries (Compensation of Employees): This includes all forms of compensation to employees
such as wages, salaries, and social contributions (both by employees and employers).
2. Gross Operating Surplus (Profits): This represents the profits of companies before taxes, including rents and
royalties. It can be divided into:
• Gross Mixed Income: Income of self-employed individuals, incorporating both labour and capital.
• Gross Operating Surplus: Profits of incorporated businesses.
3. Net Taxes on Production and Imports: This includes taxes on production and imports minus subsidies.
Examples of taxes are VAT and excise duties, and examples of subsidies are government payments to farmers.
GDP = Compensation of Employees + Gross Operating Surplus + Gross Mixed Income +
Net Taxes on Production and Imports
Expenditure Method: The value of total spending on goods and services produced within an economy.
1. Consumption: Total spending by households on goods and services. This includes expenditures on durable
goods (cars, appliances), nondurable goods (food, clothing), and services (healthcare, education).
2. Investment: Total spending on capital goods that will be used for future production. This includes business
investments in equipment and structures, residential construction, and changes in business inventories.
3. Government Spending: Total government expenditures on goods and services. This includes spending on
defence, education, public safety, and infrastructure. It does not include transfer payments like pensions and
unemployment benefits, as these do not correspond to production of goods and services.
4. Net Exports: The value of a country's exports minus the value of its imports. Exports add to a country's GDP
because they are produced domestically, while imports are subtracted because they represent spending on
goods and services produced outside the country.
GDP = Consumption + Investment + Government Spending + (Exports – Imports)
Benefits of Using GDP as a Measure of Living Limitations of Using GDP as a Measure of Living
Standards Standards
• Broad Indicator of Economic Activity: GDP per • Excludes Non-Market Activities: GDP does not
capita measures total output, which includes account for household production (e.g., meals,
goods and services essential for daily life and childcare) and other non-market activities that
enjoyment. contribute to well-being.
• Correlation with Well-being: GDP per capita is • Ignores Quality of Life Factors: Factors like social
highly correlated with other well-being relationships, clean air, personal safety, and leisure
measures, such as life expectancy and self- time are not measured by GDP.
reported life satisfaction. • Does Not Reflect Income Distribution: GDP per capita
• Standardized Comparison: It allows for measures average output but ignores how this output
standardized comparisons across different is distributed, masking income inequality where some
countries and over time, facilitating international individuals may be significantly worse off despite high
and historical economic analysis. average GDP.
• Data Availability and Regular Updates: GDP • Environmental Depletion: GDP does not consider the
data is widely available and regularly updated, depletion of natural resources or environmental