Radiation Therapy Physics
Chapter 23 Notes
Dose distributions – special representations of the magnitude of the dose produced by a source of
radiation
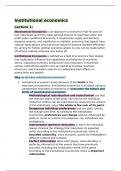
Percentage depth dose (PDD) curve – one-dimensional representation of the variation of dose
(along the central axis of the beam)
Beam profile –one-dimensional special representation of the variation of beam intensity, depicts
the beams intensity in a direction perpendicular to the beam’s direction
-the edges of the beams profile where there is a rapid increase or decrease in intensity are
known as the penumbra region
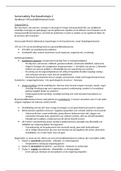
-the shape of a beams profile is a function of depth
-at shallow depths, because there is less scatter, the beams profile better characterizes the
beams “primary” intensity
The Dmax profile (depth of maximum equilibrium) illustrates the influence of the accelerators
flattening filter on the beam
At deeper depths, the scatter is more significant
At the center of the beam, the scatter is more significant
“flattening filter free” (FFF) beam, TPS systems can accurately model FFF
FFF beams are not used for simple treatments such as parallel opposed fields
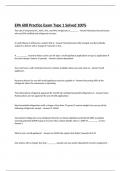
Same dose – isodose
The numeric value of the isodose line along the central (depth) axis of the isodose curves is equal
to the PDD at that depth
Isodose distributions vary with:
1) beam energy
2) SSD
3) field size
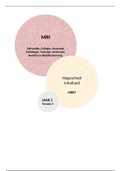
Wedged-field isodose lines are “tilted”
Standard wedges:
15º
30º
45º
60º
The tilt of isodose lines varies slightly with depth, so either the depth of the 80% depth dose or a
depth of 10cm is often chosen for a wedge angle management
The energy spectrum of wedged fields differs slightly from open fields
The simplest combined field geometry is the parallel opposed field set (the second field
compensates for dose fall-off from the first field)
Parallel fields are often used to a deliver uniform dose
Chapter 23 Notes
Dose distributions – special representations of the magnitude of the dose produced by a source of
radiation
Percentage depth dose (PDD) curve – one-dimensional representation of the variation of dose
(along the central axis of the beam)
Beam profile –one-dimensional special representation of the variation of beam intensity, depicts
the beams intensity in a direction perpendicular to the beam’s direction
-the edges of the beams profile where there is a rapid increase or decrease in intensity are
known as the penumbra region
-the shape of a beams profile is a function of depth
-at shallow depths, because there is less scatter, the beams profile better characterizes the
beams “primary” intensity
The Dmax profile (depth of maximum equilibrium) illustrates the influence of the accelerators
flattening filter on the beam
At deeper depths, the scatter is more significant
At the center of the beam, the scatter is more significant
“flattening filter free” (FFF) beam, TPS systems can accurately model FFF
FFF beams are not used for simple treatments such as parallel opposed fields
Same dose – isodose
The numeric value of the isodose line along the central (depth) axis of the isodose curves is equal
to the PDD at that depth
Isodose distributions vary with:
1) beam energy
2) SSD
3) field size
Wedged-field isodose lines are “tilted”
Standard wedges:
15º
30º
45º
60º
The tilt of isodose lines varies slightly with depth, so either the depth of the 80% depth dose or a
depth of 10cm is often chosen for a wedge angle management
The energy spectrum of wedged fields differs slightly from open fields
The simplest combined field geometry is the parallel opposed field set (the second field
compensates for dose fall-off from the first field)
Parallel fields are often used to a deliver uniform dose