Student
Name:_____________
Surname : _____________
Student Number: ________
Module Code : Mip2602
Unique Number :695941
Due date :13 August 2024
DECLARATION FORM
I _______________________________________
Student number: Module: MIP2602
Declare that…
1. I understand what plagiarism entails and am aware of the University’s policy in this
regard.
2. I declare that this assignment is my own, original work. Where I used someone
else’s work, whether a printed source, the internet or any other source, I give the
proper acknowledgement and include a complete reference list.
3. I did not use another current or previous student’s work, submitting it as my own.
4. I did not allow and will not allow anyone to copy my work with the intention of
submitting it as his or her own work.
Signature: ____________________ Date: 13 AUGUST 2024
, QUESTION 1
1.1.1. The number of coins each grade 5 learners have in their pocket and bags
1.1.2. Grade 5 learners at immaculate convent school.
1.1.3. 40 Grade 5 learners randomly
1.1.4. Data collected is quantitative, or numerical as it represents counts of coins. It
is discrete data since the number of coins can only take whole number values.
1.1.5. Histogram is the best because it shows the frequency distribution of the number
of coins across the learners.
1.2.
1.2.1.1. Pictograph is a graph that represent visual data using picture or symbols to
show the quantity
a. Each symbol in a pictograph represents a specific number of items, allowing
for easy comparison of different categories.
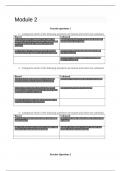
1.2.1.2. Pictogram representing the cellphone sold in PRAYASH'S shop
Pictogram representing the cellphone sold in
prayash's shop
8
7
6
key
5
NUMBER SOLD
1 phone = 2
4
3 Frequency
2
1
0
Red Phones Blue Phones Green Phones Yellow Phones
Frequency 6 4,5 7 3
PHONE COLOURS
1.2.2. Bar graph t because it shows the frequency distribution of the number of coins
across the learners through categories
Name:_____________
Surname : _____________
Student Number: ________
Module Code : Mip2602
Unique Number :695941
Due date :13 August 2024
DECLARATION FORM
I _______________________________________
Student number: Module: MIP2602
Declare that…
1. I understand what plagiarism entails and am aware of the University’s policy in this
regard.
2. I declare that this assignment is my own, original work. Where I used someone
else’s work, whether a printed source, the internet or any other source, I give the
proper acknowledgement and include a complete reference list.
3. I did not use another current or previous student’s work, submitting it as my own.
4. I did not allow and will not allow anyone to copy my work with the intention of
submitting it as his or her own work.
Signature: ____________________ Date: 13 AUGUST 2024
, QUESTION 1
1.1.1. The number of coins each grade 5 learners have in their pocket and bags
1.1.2. Grade 5 learners at immaculate convent school.
1.1.3. 40 Grade 5 learners randomly
1.1.4. Data collected is quantitative, or numerical as it represents counts of coins. It
is discrete data since the number of coins can only take whole number values.
1.1.5. Histogram is the best because it shows the frequency distribution of the number
of coins across the learners.
1.2.
1.2.1.1. Pictograph is a graph that represent visual data using picture or symbols to
show the quantity
a. Each symbol in a pictograph represents a specific number of items, allowing
for easy comparison of different categories.
1.2.1.2. Pictogram representing the cellphone sold in PRAYASH'S shop
Pictogram representing the cellphone sold in
prayash's shop
8
7
6
key
5
NUMBER SOLD
1 phone = 2
4
3 Frequency
2
1
0
Red Phones Blue Phones Green Phones Yellow Phones
Frequency 6 4,5 7 3
PHONE COLOURS
1.2.2. Bar graph t because it shows the frequency distribution of the number of coins
across the learners through categories