PHYS 1000/1033 Lab Report Template-Online Mode
_______________________________________________________________________________________
SURNAME: BAHINI
FIRST NAME ARMAND
DATE: 13/10/2020
DIFFRACTION GRATING Memo and marking scheme
(20 marks)
INTRODUCTION
This experiment, diffraction grating, involves passing light through a diffraction grating, thin film
of glass or plastic that has many lines per mm (±300lines/mm) and measuring the angle of
diffraction of the various wavelengths of the diffracted light (colour spectrum).
When a light source passes through a diffraction grating it generates a number of sources. The
spaces between each adjacent line on the grating becomes independent source. The sources emit
in phase waves that have more or less than the same wavelength. Each source works
independently sending out waves in all directions. (1)
One is then able to calculate the wavelengths using the measured diffraction angles.
AIMS & OBJECTIVES
The aim of this experiment is to measure the wavelength of the four lines in the spectrum of the mercury
lamp using two methods:
the method of normal incidence;
the method of minimum deviation. (1)
A spectrometer equipped with a diffraction grating is used to identify the specific wavelengths from the
emission spectrum of mercury and to measure these wavelengths precisely.
RESULTS & CALCULATIONS
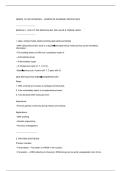
Calculation of d:
d (m)
d = 1/N = 1/300mm= 3.33 x 10⁻³mm = 3.33 x 10⁻⁶m. (1)
TABLE 1: Calculation of the spacing d between the slits (lines) on the grating, given that there are
300 lines/mm of the grating used.
METHOD 1: Normal incidence
, Important instructions!!!
Students must calculate the values to be entered in the table based on the readings
from the main scale and the vernier scale. Please note that the vernier scale is 60
minutes long while the smallest division on the main scale is 0.5o = 30 minutes. As
such after converting the vernier scale reading into degrees by dividing it by 60 (60
minutes = 1deg.), they must multiply the result by 0.5 deg before adding it to the
main scale reading. For example, the first value entered in the Tables below is given
by
– (6.5 + (9/60) x 0.5o) = -6.65
The error in every θ values is given by the vernier scale as its smallest division. Here
it is given by:
1
Δθ = ×0.5=0.008
60
The error in θav = |θR - θL| value is given by:
Δθav = 0.5 × √ 0.0082 +0.0082=0.0056
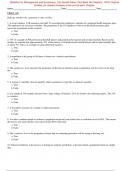
The error in λ value is given by
d
Δλ= cosθ av Δθav
n
where Δθ is in radians.
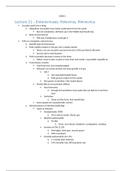
TABLE 1: Angles measured for diffracted beams and their corresponding calculated wavelengths obtained
by the method of normal incidence.
Calculated
Angle (°)
wavelength (nm)
Color θL ( ± 0.008 ) θR ( ± 0.008 ) θav ( ± 0.0056 ) λ ± 0.326
Purple - 6.65 7.158 6.9
400
Green - 9.058 9.24 9.15
(4)
529.53
Yellow-1 - 9.68 9.7 9.69
576
Yellow-2 - 9.925 9.716 9.82
568
Red - 10.85 10.766 10.81
624.5
NB: The four (4) marks take into account the righteousness of the values in the table, the errors
reported as well as the units.
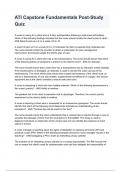
The error in λ value using Dm = |undeviatedangle – deviatedangle| is given by
Dm D
Δλ=2 d cos ( )( )
2
Δ m
2
_______________________________________________________________________________________
SURNAME: BAHINI
FIRST NAME ARMAND
DATE: 13/10/2020
DIFFRACTION GRATING Memo and marking scheme
(20 marks)
INTRODUCTION
This experiment, diffraction grating, involves passing light through a diffraction grating, thin film
of glass or plastic that has many lines per mm (±300lines/mm) and measuring the angle of
diffraction of the various wavelengths of the diffracted light (colour spectrum).
When a light source passes through a diffraction grating it generates a number of sources. The
spaces between each adjacent line on the grating becomes independent source. The sources emit
in phase waves that have more or less than the same wavelength. Each source works
independently sending out waves in all directions. (1)
One is then able to calculate the wavelengths using the measured diffraction angles.
AIMS & OBJECTIVES
The aim of this experiment is to measure the wavelength of the four lines in the spectrum of the mercury
lamp using two methods:
the method of normal incidence;
the method of minimum deviation. (1)
A spectrometer equipped with a diffraction grating is used to identify the specific wavelengths from the
emission spectrum of mercury and to measure these wavelengths precisely.
RESULTS & CALCULATIONS
Calculation of d:
d (m)
d = 1/N = 1/300mm= 3.33 x 10⁻³mm = 3.33 x 10⁻⁶m. (1)
TABLE 1: Calculation of the spacing d between the slits (lines) on the grating, given that there are
300 lines/mm of the grating used.
METHOD 1: Normal incidence
, Important instructions!!!
Students must calculate the values to be entered in the table based on the readings
from the main scale and the vernier scale. Please note that the vernier scale is 60
minutes long while the smallest division on the main scale is 0.5o = 30 minutes. As
such after converting the vernier scale reading into degrees by dividing it by 60 (60
minutes = 1deg.), they must multiply the result by 0.5 deg before adding it to the
main scale reading. For example, the first value entered in the Tables below is given
by
– (6.5 + (9/60) x 0.5o) = -6.65
The error in every θ values is given by the vernier scale as its smallest division. Here
it is given by:
1
Δθ = ×0.5=0.008
60
The error in θav = |θR - θL| value is given by:
Δθav = 0.5 × √ 0.0082 +0.0082=0.0056
The error in λ value is given by
d
Δλ= cosθ av Δθav
n
where Δθ is in radians.
TABLE 1: Angles measured for diffracted beams and their corresponding calculated wavelengths obtained
by the method of normal incidence.
Calculated
Angle (°)
wavelength (nm)
Color θL ( ± 0.008 ) θR ( ± 0.008 ) θav ( ± 0.0056 ) λ ± 0.326
Purple - 6.65 7.158 6.9
400
Green - 9.058 9.24 9.15
(4)
529.53
Yellow-1 - 9.68 9.7 9.69
576
Yellow-2 - 9.925 9.716 9.82
568
Red - 10.85 10.766 10.81
624.5
NB: The four (4) marks take into account the righteousness of the values in the table, the errors
reported as well as the units.
The error in λ value using Dm = |undeviatedangle – deviatedangle| is given by
Dm D
Δλ=2 d cos ( )( )
2
Δ m
2